

Many environmentalists love to point to public transportation as the blessed technology and policy which would reduce oil consumption and dependence. I agree that increasing public transportation can be helpful, but how helpful and how long would it take to have what level of impact ?
In the big energy picture, the USA uses 40% of its oil for cars. So more mass transit will not help with oil used for factories, home heating, trains, freight trucks and other uses.
I will show that going from 3-5% public transportation up to 20-30% will still leave 70-80% driving cars. It will cost 1% of GDP for 50 years. So 40% of oil for cars goes to 30%. US 20.8 million barrels of oil per day goes to 18.5-20 million barrels of oil per day. After decades of a massive public transportation system overhaul which would be politically difficult [perhaps impossible] to enact in many cities.
Which is why the nextbigfuture energy plan has a different focus.
Book on Australia and New Zealand public transportation It is from the early, mid-90s but there has been no significant change in the situation.

Public transportation trips in Auckland over time
http://www.med.govt.nz/templates/MultipageDocumentPage____28646.aspx
Comparison of some other cities over times
Perth -7.1% per capita ridership since 1981 versus 2005.
Portland and Brisbane are among the cities with more public transport per capita since 1981.
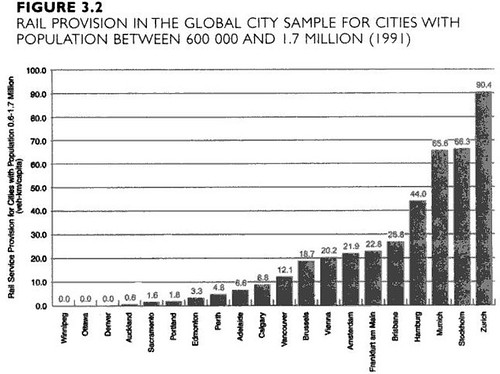
Perth and Adelaide and Auckland all are among the cities with less mass transit per person. How much would it cost and how long would it take to get up to the higher levels. Add 60km of rail per person. In each low transit city.
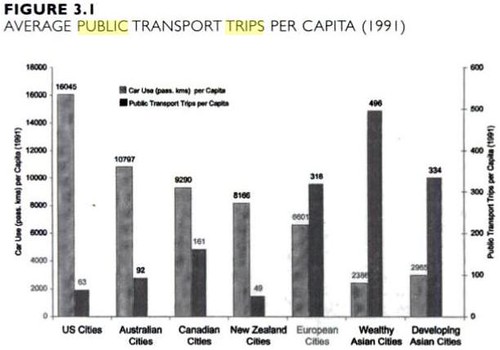
Comparing transit and commuter trips for USA, Australia, Canada, europe and Asia.
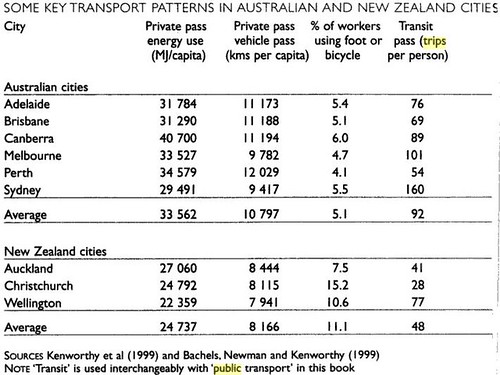
Transportation in Australian and New Zealand cities
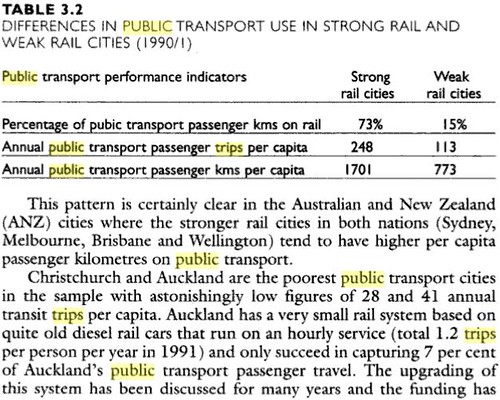
Stronger versus weaker rail cities in Australia and New Zealand
2005 view of public transportation in many cities
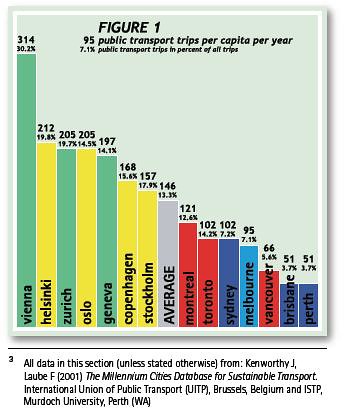
Public transportation for cities in 2001-2005.
So copy Vienna and 50 years of 1% of city GDP (or more for a shorter period of time, this would be trillions of dollars on a global scale.) on public rail plus all decisions needed to transform city planning and layouts for higher public transportation usage to get closer to the higher commuter usage rates. Note: the highest usage rates are 20-30% in Europe. Maybe some highly dense asian cities are doing better. The Philippines with a lot of jeepnees. (Local made jeep/buses where people with less money ride at to 20 to a vehicle, some hanging on the outside. Two jeepnees crashing together can result in 30-50 deaths.)
So up from 3-5% up to 20-30%. That still leaves 70-80% driving cars.
So 40% of oil for cars goes to 30%. US 20.8 million barrels of oil per day goes to 18.5-20 million barrels of oil per day. After decades of a massive public transportation system overhaul.

Brian Wang is a Futurist Thought Leader and a popular Science blogger with 1 million readers per month. His blog Nextbigfuture.com is ranked #1 Science News Blog. It covers many disruptive technology and trends including Space, Robotics, Artificial Intelligence, Medicine, Anti-aging Biotechnology, and Nanotechnology.
Known for identifying cutting edge technologies, he is currently a Co-Founder of a startup and fundraiser for high potential early-stage companies. He is the Head of Research for Allocations for deep technology investments and an Angel Investor at Space Angels.
A frequent speaker at corporations, he has been a TEDx speaker, a Singularity University speaker and guest at numerous interviews for radio and podcasts. He is open to public speaking and advising engagements.