

The most recent IMF forecast of GDP (Purchasing power parity) is that China would pass the USA in about 2016. However, the IMF forecast had the US economy growing by 23% from 2010 to 2015. The conference board is calculating a lower GDP PPP for the USA and a higher GDP PPP for China versus the IMF numbers even for 2009.
Here is a summary of key results of the conference board global forecast to 2020
The conference board PPP-adjusted GDP figure for China’s GDP for 2009 is $11.6 trillion, while the nominal figure offered by the International Monetary Fund and others for that year has been more along the lines of $5 trillion.
Barrons has the conference board projections
GDP (constant) in millions US$, ppp-adj
        United States  China
2000  12,219,604  4,337,325
2001  12,351,532  4,800,704
2002  12,575,547  5,396,402
2003  12,888,712  6,213,749
2004  13,349,260  6,841,338
2005  13,757,016  7,552,836
2006  14,124,714  8,511,474
2007  14,399,780  9,719,364
2008  14,399,670  10,651,923
2009 *  14,020,652  11,621,248
2010  14,385,189  12,783,373
2011  14,557,812  14,009,231
2012  14,848,532  15,286,673
2013  15,145,057  16,680,600
2014  15,447,505  18,201,634
2015  15,755,992  19,861,363
2016  16,151,298  21,434,069
2017  16,556,522  23,131,309
2018  16,971,913  24,962,943
2019  17,397,725  26,939,613
2020  17,834,221  29,072,804
List of google news articles on the conference board forecast
Barrons discusses the forecast.
The Wall Street Journal discusses the forecast
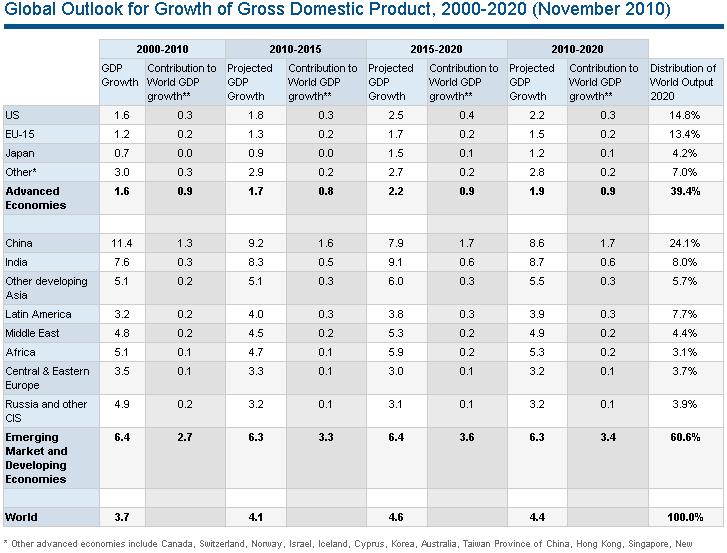
China could account for almost one quarter of the global economy in 2020, compared to 15% for the U.S. and 13% for Western Europe, or the 15 original European Union countries that include Germany and France. India, meantime, is expected to have 8% of the world’s output in ten year.
Bart van Ark, chief economist at the Conference Board, cautioned the main risks to the projections are if China’s fast-growing economy is hit by uncontrolled inflation or asset bubbles.
But his baseline scenario is that together with India, China will account for half of global growth from 2010 to 2020. Over the next decade, growth in emerging economies is expected to be more than three times faster than growth in advanced economies.
Becoming the world’s largest economy would pose “big challenges” for China by increases its responsibility to ensure the global economy runs smoothly while still dealing with a fragile domestic economy, van Ark said.
Here is the conference board discussion of purchasing power parity
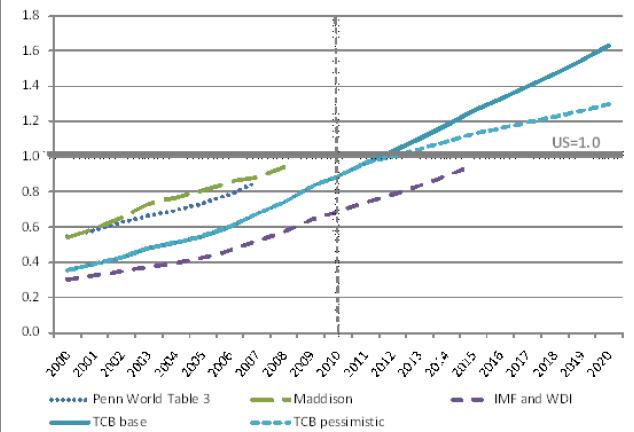
There are major discrepancies, however, between different measures of PPP-converted GDP, especially for the case of China. These depend on factors related to the exact methodology, price measures, and weighting systems that are employed to compute the various PPP. Typically, the original 2005 PPP used by the World Bank and the International Monetary Fund is relatively high compared to various alternatives. As a result the level of GDP for China comes out relatively low (42 percent in 2005). In contrast, both Angus Maddison’s Statistics on World Population, GDP and Per Capita GDP, 1-2008 AD and the Penn World Tables version 6.3 provide PPPs based on previous rounds of prices, which indicate much lower price levels in China and, therefore, much higher GDP. According to these measures, China’s GDP would have been 75–80 percent of the U.S. level in 2005 and would have already surpassed the U.S. level by now.
A recent evaluation of the 2005 World Bank PPPs by Angus Deaton and Alan Heston concludes that they have some important deficiencies.2 In particular, the authors suggest that the China/U.S. 2005 PPP was based on price measures for outlets carrying types and brands in 11 cities that could have been as much as 20 percent higher than national prices. As an alternative, Deaton and Heston propose to raise the estimates of China GDP in U.S. dollars by 10 percent relative to the World Bank estimate for 2005. In addition to the specific China adjustment, Deaton and Heston propose an adjustment for global weighting for individual countries and an adjustment for the net foreign balance using a PPP rather than an exchange rate. Taken together, these measures would raise China’s GDP in PPP-converted dollars by 13 percentage points (from 42 to 55 percent of the U.S. level) relative to the World Bank/IMF measure in 2005.
The measures of PPP-converted GDP for China in The Conference Board Global Economic
Outlook 2011, which adopted the procedures proposed by Deaton and Heston, are higher than those of the World Bank and the IMF, but significantly lower than those found in Maddison and PWT 6.3 (Chart 1).4 Extrapolating the measures forward from 2005, The Conference Board measure of GDP suggests that China will overtake the United States in the size of its GDP by 2012, driven in large part by the difference in growth rates between China and the United States between 2007 and 2009. According to the IMF measure, China’s GDP will overtake that of the United States in 2016. If the base scenario in The Conference Board Global Outlook is realized, GDP in China would be as much as 60 percent higher as the U.S. GDP by 2020. In a more negative scenario, China would reach a larger size of only 30 percent beyond the U.S. by 2020. It is important to realize that, according to these measures, average GDP per capita in China in 2010 was still only 21 percent of the U.S. level, and it will rise to 40 percent in 2020 in the base scenario and to 32 percent in the pessimistic scenario.
If you liked this article, please give it a quick review on ycombinator, or Reddit, or StumbleUpon. Thanks
Featured articles
Ocean Floor Gold and Copper
Ocean Floor Mining Company

Brian Wang is a Futurist Thought Leader and a popular Science blogger with 1 million readers per month. His blog Nextbigfuture.com is ranked #1 Science News Blog. It covers many disruptive technology and trends including Space, Robotics, Artificial Intelligence, Medicine, Anti-aging Biotechnology, and Nanotechnology.
Known for identifying cutting edge technologies, he is currently a Co-Founder of a startup and fundraiser for high potential early-stage companies. He is the Head of Research for Allocations for deep technology investments and an Angel Investor at Space Angels.
A frequent speaker at corporations, he has been a TEDx speaker, a Singularity University speaker and guest at numerous interviews for radio and podcasts. He is open to public speaking and advising engagements.