

* High-performance architecture processes and analyzes documents at rates of up to 1 TB per day.
* Robust File Support: Processes and analyzes over 400 different file types, including support for OCR of images containing text.
* Intelligent De-Duplication: Automatically de-duplicates data across multiple data stores and across the entire data set.
* Multi-Language Support: Provides full Unicode compliance and enables automatic language identification of documents.
SEARCH & ANALYSIS
Transparent Keyword Search: Enables a more defensible and collaborative e-discovery search process and enhances the ability to cull irrelevant information.
• Keyword Search Preview: Provides matching keyword variations prior to running a search. Users can selectively include relevant variations or exclude false positive variations.
• Keyword Search Filters: Enables real-time search result filtering for individual queries or variations and allows users to sample the filtered documents.
• Keyword Search Report: Provides comprehensive reporting that documents all search criteria and provides detailed analytics of the results.
Transparent Concept Search: Delivers a unique set of features that enable an interactive, relevant, and defensible search process.
• Concept Search Preview: Allows users to contextually refine searches by previewing related terms, and selecting only those that are relevant before
actually running a search.
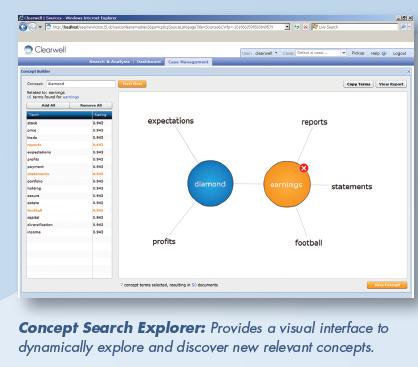
• Concept Search Explorer: Provides a visual interface to dynamically explore and discover new relevant concepts.
• Concept Search Report: Automatically documents the related terms included in each concept search and provides detailed analytics of search results.
Multi-Keyword Search: Runs up to 100 searches simultaneously and provides reporting to test effectiveness of searches.
Advanced Search: Construct advanced searches for multiple fields using Boolean, stemming, wildcard, fuzzy, and proximity searches.
Auto-Filters: Narrow search results using automatically-generated clickable filters that provide exact document counts.
Discussion Threads: Links together all related messages into chronological threads that capture entire discussions, including all replies, forwards, and carbon
copies.
Topic Classification: Automatically organizes documents into specific topics, enabling users to quickly analyze all documents related to a particular subject.
People Analytics: Monitors and lists the frequency of communications between key custodians.
Term Analytics: Leverages natural language algorithms to uncover secret project names and code words that may be relevant to a case.
Cataphora Process
Cataphora sifts employees’ digital communications on and off the job for signs of conspiracy to cover up company wrongdoing—or to initiate a scam (context aware).
Cataphora Analytics
1. The Sequence Viewer introduces a new unit of analysis, discussions(TM), based on causal relationships between items.
2. Periodic Sequence Detection

The graphic above shows two sequences of events from a price fixing investigation. The gaps between events are shown as circles, which emphasizes changes in frequency. Meetings with competitors are not necessarily illegal. They can be related to professional organizations, for example. But looking a bit closer, we see an interesting pattern. A large gap in discussions about price increases corresponds to a period in which the number of such meetings increases greatly. As the regularity of such meetings levels off, discussions of price fixing increase steadily. The beginning of a conspiracy? Such meetings would certainly provide opportunity to collude. Further investigation is warranted.
3. Temperature Gauge
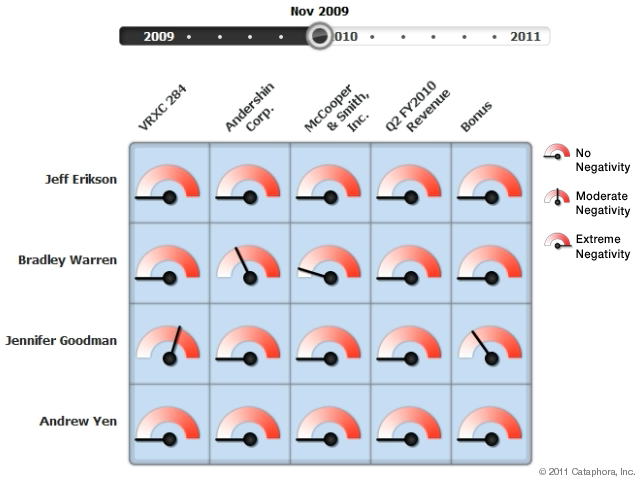
The Temperature Gauge Analytic can guide a review or probe. It can quickly shed light on HR events, such as whether a manager is treating employees differently based on the protected class status of the employees. For example, this would be detected by the manager clearly showing irritation towards members of that protected class.
4. Actor Proximity
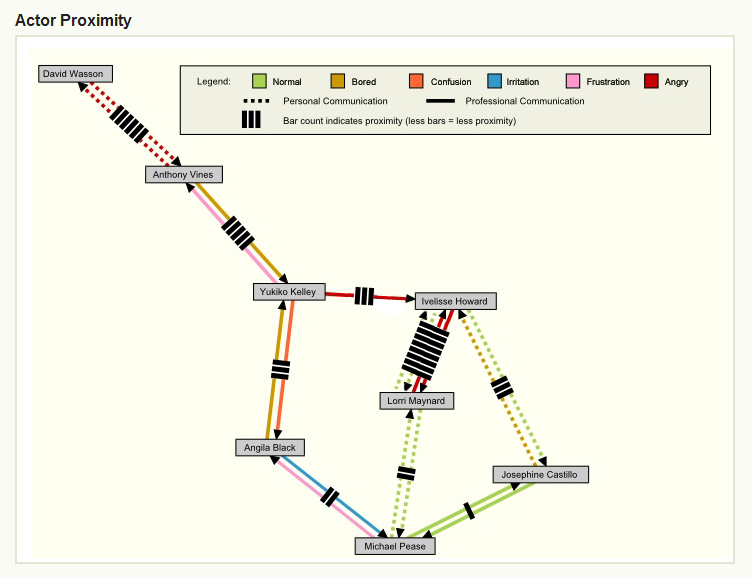
Proximity measurement can be used to direct an investigation. After all, once you know some of the people involved in a questionable activity, those closest to them are good candidates to help fill in more of the picture. Proximity can be a point of contention in and of itself, for verifying witness statements (e.g. “I didn’t know the defendant that well”).
5. The Real Org Chart

In this graph, the points are people. The points in red are the likely day-to-day decision-makers. The lines are based on “mere-forwards,” emails forwarded on with little additional text (in particular, without explicit instructions). We usually forward information to those we think need to know about it for some reason, and they forward that information in turn on the same basis. Analyzing a graph such as this identifies those with the largest information gathering networks. Such persons tend to be the decision makers.
6. Stressful Topics

Cataphora’s Stressful Topics/Group Sentiment Analysis is an investigative tool that shows a select group of actors (on the left) and how these actors react negatively to a variety of topics (shown on the top of the matrix) over a period of time. The emoticons show the specific kinds of stress that were produced by various topics, as determined by linguistic analysis of the tone throughout communications.
If you liked this article, please give it a quick review on ycombinator or StumbleUpon. Thanks

Brian Wang is a Futurist Thought Leader and a popular Science blogger with 1 million readers per month. His blog Nextbigfuture.com is ranked #1 Science News Blog. It covers many disruptive technology and trends including Space, Robotics, Artificial Intelligence, Medicine, Anti-aging Biotechnology, and Nanotechnology.
Known for identifying cutting edge technologies, he is currently a Co-Founder of a startup and fundraiser for high potential early-stage companies. He is the Head of Research for Allocations for deep technology investments and an Angel Investor at Space Angels.
A frequent speaker at corporations, he has been a TEDx speaker, a Singularity University speaker and guest at numerous interviews for radio and podcasts. He is open to public speaking and advising engagements.