

We start by asking what makes countries successful.
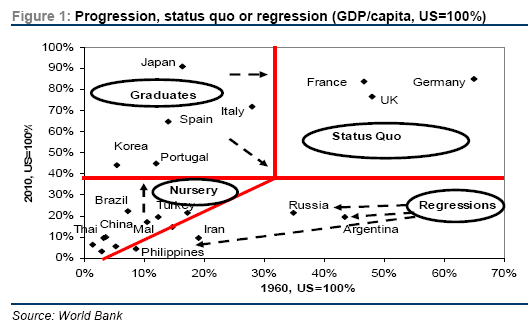
■ The key message is that progression from low to middle and high income is not automatic and most emerging markets fail to progress beyond exploiting cheap labour and resources. Regressions are just as common as failure to progress and more common than successes.
■ We identify five key factors that, in our view, enhance the chances of success. We believe that it is the interaction between the quality of human capital, innovation, physical infrastructure, business climate and demographics that tends to drive ‘graduates’, whether the US in the 19th century or Japan and Korea in the 20th. Perhaps the most important lesson is consistency. Progress depends on productivity growth at 4%-plus p.a. for at least 30 years. Occasional growth spurts are indicative of long-term failure.
■ In our view, China and Malaysia are arguably the best-positioned large APAC countries to progress towards developed market status over the next decade. China, in particular, satisfies most of the key requirements, even though we believe probability of success, is still not much more than 50%, with re-balancing and overinvestment being the biggest hurdles. Either a success or a failure, China is likely to turn from an opportunity to a threat, and in our review we have identified several global sectors that are likely to come under attack as well as China’s key beneficiaries.
NOTE – this comparison of PPP GDP per capita is using World Bank PPP (purchasing power parity)
There are new calculations that China PPP is 70% higher than what the World Bank calculates.
Based on the work of Angus Deaton and Alan Heston, Arvind argued that the International Monetary Fund’s GDP estimate for China for 2005 was understated by 27 percent.
And between 2005 and 2010, the International Monetary Fund (IMF) had overstated the increase in the relevant PPP prices in China, and hence understated the increase in GDP between these dates by 20 percent. Conceptually, the “mistake” that the IMF made (and continues to make) is to project these PPP prices based on the evolution of the macroeconomic real exchange rate (changes in a country’s nominal exchange rate vis-à-vis the dollar deflated by changes in aggregate prices between that country and the US dollar). But the computation of the relevant price index for the PPP calculations requires the evolution in the internal real exchange rate, measured as the change in domestic prices of tradable goods to non-tradable goods
Combining these two factors, China’s GDP (in PPP dollars) estimate for 2010 for China was greater than that of the IMF by 47 percent.
Based on the work of Angus Deaton and Alan Heston, Arvind argued that the International Monetary Fund’s GDP estimate for China for 2005 was understated by 27 percent. In fact, I used for 2005 the number in the Penn World Table (series China, version 2 in PWT 7; available online since June 2011).
* And between 2005 and 2010, the International Monetary Fund (IMF) had overstated the increase in the relevant PPP prices in China, and hence understated the increase in GDP between these dates by 20 percent. Conceptually, the “mistake” that the IMF made (and continues to make) is to project these PPP prices based on the evolution of the macroeconomic real exchange rate (changes in a country’s nominal exchange rate vis-à-vis the dollar deflated by changes in aggregate prices between that country and the US dollar). But the computation of the relevant price index for the PPP calculations requires the evolution in the internal real exchange rate, measured as the change in domestic prices of tradable goods to non-tradable goods
Combining these two factors, China’s GDP (in PPP dollars) estimate for 2010 for China was greater than that of the IMF by 47 percent. This implies China’s 2010 GDP PPP exceeded $17 trillion and in 2012 will reach $20 trillion. By the end of 2012, China would have PPP GDP per capita of about $14,800.
The adjusted per capita PPP GDP would put China at 29% of US per capita GDP.
By 2015, China could be at 35% of US GDP PPP (If China maintains about 8% GDP growth and the US maintains 2.5% growth). By 2018, China would be at 40% of US GDP PPP.
Credit Suisse has surveyed and determined that China has a 30% shadow economy. This is an underground economy of bribes and other hidden money. The US has about 16% shadow economy. Adding both the US and China shadow economy would mean that China is at about 34% of US per capita GDP PPP in 2012.


Labour productivity: The key driver
There is little doubt that over time, GDP/capita growth rates (both nominal and PPP) are driven primarily by the ability of individual countries to grow their underlying core labour productivity.
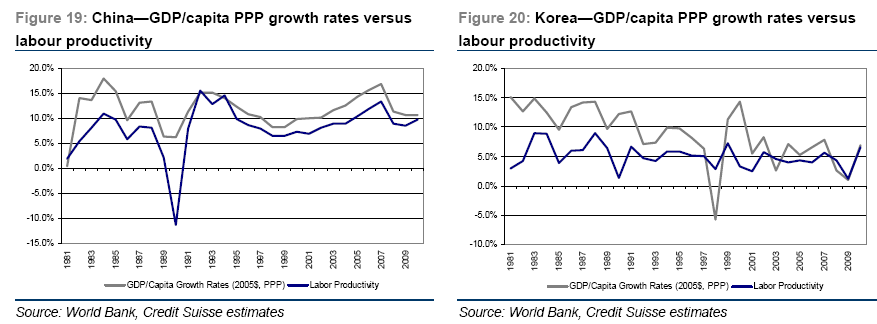
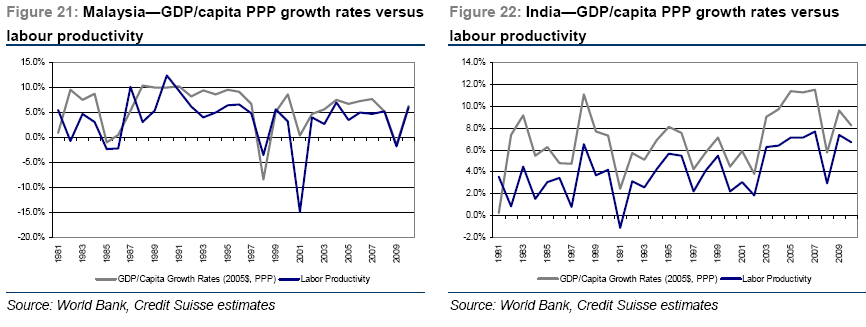
We have reached three key conclusions:
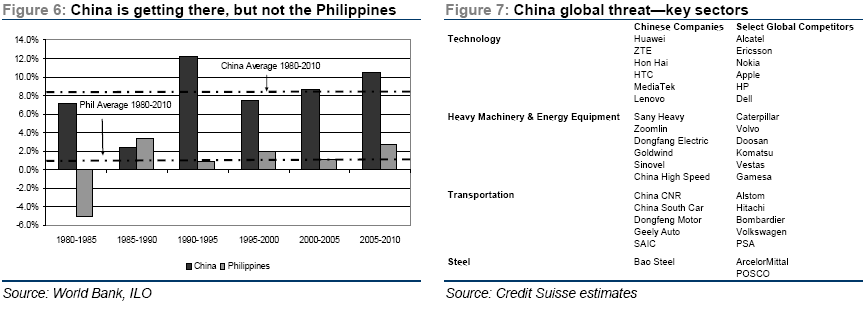
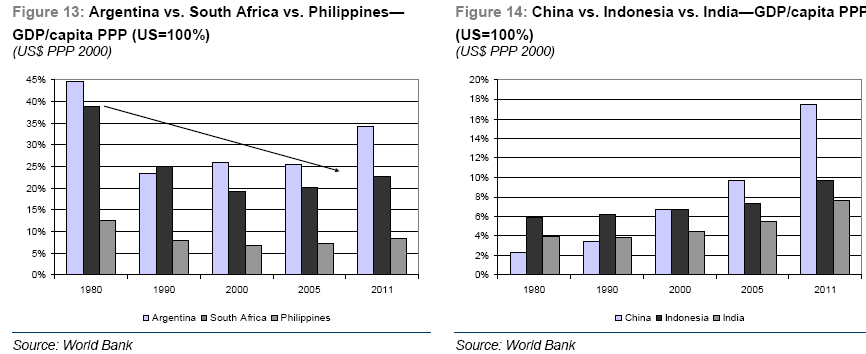
(1) It seems to take at least two to three decades of strong and consistent labour productivity growth rates for a country to graduate to the developed market status (usually defined as a minimum of around 35-40% of US GDP/capita). Occasional “growth spurts” are insufficient. High, steady and consistent growth over time seems to be the right formulae that enabled markets such as Korea and Japan to avoid the “fate” of Argentina, South Africa or the Philippines and graduate to developed market ranks;(2) China is the only country within our survey that is following the path taken by Korea and Japan, with strong and consistent productivity growth rates. India is improving, albeit from a very low base, and Thailand and Malaysia do not yet exhibit the degree of required consistency.
(3) Most other markets (such as the Philippines, South Africa, LatAm, Turkey or Russia) do not seem to be delivering either strength or consistency for the required productivity gains. In many ways, the significant jump in labour productivity in Russia in 2000-10 was largely a reflection of restarting of the country’s productive capacity following the massive collapse experienced in the 1990s, rather than an indication of significant underlying acceleration.
Our assessment is that China is clearly running a distorted business model (effectively a mirror image of an equally distorted US business model) and appears to be increasingly on the Japanese “tracks”, with limited capacity to rebalance its economy within a reasonable (say three to five years) timeframe. It is battling significant demographic pressures, with far too many of its citizens in the 40-45 age cohort with inevitably high savings rates.
The combination of demographics; poor social, healthcare or education “safety nets”, transfer subsidies (through China’s banking system) from households to state enterprises and suppressed Rmb exchange rates conspires to keep China’s consumption levels suppressed. Low consumption (relative to GDP) occurs despite the fact that China is currently going through the “Lewis Turning Point” which normally results in a significant shift in the structure of the economy towards far greater reliance on consumption.
The Lewis Turning Point (named after Sir Arthur Lewis who first described the typical transition path for emerging markets) essentially describes an economy transitioning from agriculture and other primary occupations towards higher value-added manufacturing. Whether one looks at Japan in the 1960s or Korea in the late 1970s-early 1980s, this transition was accompanied by increasing scarcity of labour, rising wage levels and significant acceleration in consumption levels. An economy that passes through the Lewis turning point (and occurs when manufacturing employment matches the number of nonmanufacturing jobs) tends to be a “double edged” sword, as it is usually accompanied by increasing social dislocation, rising wages and pressure on the economy to move up the value chain. Most economies do not succeed in this transition (such as South Africa, Russia and Argentina) but some do (such as Korea and Japan).
As can be seen below, China is truly on the cusp of the Lewis Turning Point, with the ratio of manufacturing to primary jobs reaching 0.8x versus 0.5x in 2005 and 0.4x in 1995 and 0.25x in the late 1970s. As can be seen below, experiences of both Korea and Japan illustrate that economy transiting through this stage tends to undergo significant acceleration in real wages and consumption
The good news is that as was the case with Korea and Japan, the composition of China’s productive capacity and exports is already rapidly changing towards higher value-added services (refer to “China as a disruptive force” section).
This is highly encouraging as increasing value added in the production cycle is the only way to offset the rising wage and other associated costs to drive wage and consumption growth, thus gradually rebalancing the underlying economy.
However, the key differences between China of 2011–12, and Japan of the 1960s and Korea of the 1980s are:
1. Demographics; and
2. Poor state of China’s social support infrastructure.
In terms of demographics, China today is a far older society than either Korea in the 1980s or Japan in the 1960s. Indeed, China’s current demographics are broadly in line with that of Japan in the late 1980s (i.e., over 20 years after Japan passed through its own Lewis turning point) and that of Korea today (i.e., more than a decade since Korea passed the Lewis turning point).
As we have discussed earlier in this report, Japanese society in 1960 was incredibly young, with around 30% of the population below the age of 15. Korea in 1980 was even younger, with a ratio of 34% below the age of 15. In China, the current estimate of population below the age of 15 is close to 18%.
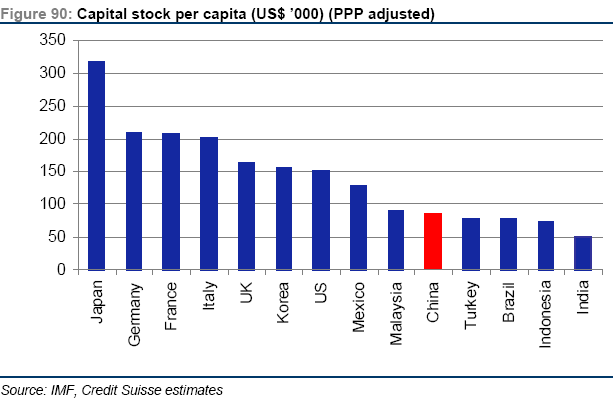
While the likelihood of China continuing to invest around US$3–4 tn per annum over the next several years is naturally compounding fears of overcapitalisation, it should be remembered that this torrid pace of investment has only commenced less than a decade ago and that China’s starting position (1998–99) could best be characterised as being grossly undercapitalised.
We estimate that even by December 2010, the overall capital stock in China was still less than US$20 tn (or around US$15,000 per capita). Even if adjust for the PPP differences, the likely capital stock is not much more than US$80,000–90,000/capita. This compares with over US$150,000 for the US, over US$300,000 (PPP) for Japan and indeed is not that much higher than equivalent numbers in Turkey, South Africa or Brazil.
If you liked this article, please give it a quick review on ycombinator or StumbleUpon. Thanks

Brian Wang is a Futurist Thought Leader and a popular Science blogger with 1 million readers per month. His blog Nextbigfuture.com is ranked #1 Science News Blog. It covers many disruptive technology and trends including Space, Robotics, Artificial Intelligence, Medicine, Anti-aging Biotechnology, and Nanotechnology.
Known for identifying cutting edge technologies, he is currently a Co-Founder of a startup and fundraiser for high potential early-stage companies. He is the Head of Research for Allocations for deep technology investments and an Angel Investor at Space Angels.
A frequent speaker at corporations, he has been a TEDx speaker, a Singularity University speaker and guest at numerous interviews for radio and podcasts. He is open to public speaking and advising engagements.