
The UN Human Development Index (HDI) is a composite statistic of life expectancy, education, and income indices to rank countries into four tiers of human development. It was created by economist Mahbub ul Haq, followed by economist Amartya Sen in 1990, and published by the United Nations Development Program.
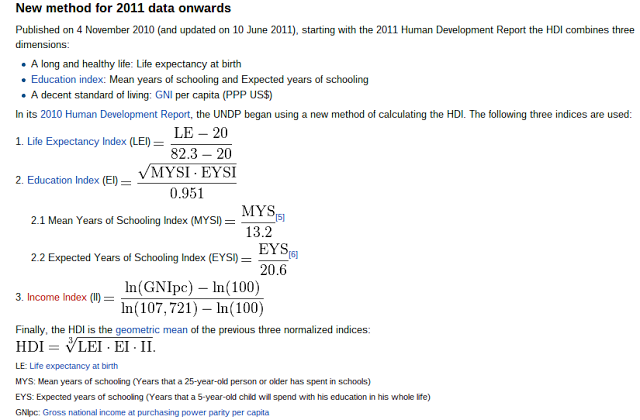
We can see that the current formula has a country would have 1.00 ranking in the current index with
* a life expectancy at birth 82.3 years
* mean education years 13.2 years for someone 25 years old or older
* expected educations years 20.6 years for someone 5 years old
* Gross national income at purchasing power parity per capita (2005 international dollars) 107,721
Very highly developed are scores from 0.80 to 0.999
Highly developed are scores from 0.70 to 0.799
Middle developed are scores from 0.60 to 0.699
Least developed are scores below 0.599
So levels beyond very highly developed would be
Beyond very highly developed category 1 would be 1.0 to 1.199
Beyond very highly developed category 2 would be 1.2 to 1.399
Beyond very highly developed category 3 would be 1.4 to 1.599
Beyond very highly developed category 4 would be 1.6 to 1.799
Beyond very highly developed category 5 would be 1.8 to 1.999
Beyond very highly developed category 6 would be 2.0 to 2.199

Getting to human development index 2.0 would be a country with
* Life expectancy of 142.3 years
* mean education years 26.4 years for someone 25 years old or older
* expected educations years 41.2 years for someone 5 years old
* GNI per capita (2005 international dollars) of $107,721,000 [The wealth part of the formula is a natural log. So doubling adds 0.1 and you have to go 1000 times to get a +1.0]
Monaco has an average life expectancy at birth of 89.68 years and a GNI per capita (2005 international dollars) of about $100,000 Monaco should have a development index of about 1.04. (Monaco has a population of 35,000)
It is possible to get closer to those metrics and improve a country more than the difference that Norway is beyond India. There should not be any dispute that increasing life expectancy is a worthwhile goal and increasing per capita GDP is a worthwhile goal. They are the basis for how the UN measures human development.
Yet there are those who dispute the goal of increasing lifespans beyond 83 years and question increasing per capita GDP. If the very highly developed and highly countries did not exist would there be arguments in Africa about increasing life expectancy beyond 70 years or GNI per capita beyond $10,000 ?
The UN does reset the formula every few years to have new life expectancy and per capita levels. They can also look at new measures for education.
There is research to study the genetics of supercentenarians (who live over 110 years). The siblings of supercentenarians are about 20 times more likely than the general population to live past 100 years.
There is the SENS anti-aging program to repair the damage of aging and full initial success would probably enable lives to be extended by about 30 years.
George Church is also developing other genetic and synthetic biology means to rejuvenate neurons and other tissues in the body.
Megacities via superskyscrapers, robotic cars and terabit per second or better communication for max GDP per capita
Sky City Skyscrapers (200-300 stories) and robotic cars (4 times the density of road traffic) will make certain megacities (future New York, Shanghai, Tokyo etc…) one third to one half of the overall world population and they would have 75% more GDP per capita than they do today. There would be rural, regular urban then super-urban. Research shows that doubling population and increased urban density boosts productivity by about 15%.
Serious study of the role of location and density in economic development probably owes its origins to Alfred
Marshall’s work on location and economic development in the early 1900s. Cities are economic drivers – the very core of economic growth and development. Higher earnings paid to urban workers and premiums paid by firms to be in urban areas are evidence of cities’ productive advantages. In the US, for example, earnings in cities are around 33% more than those in non urban areas (Glaeser and Mare, 2001). Even within Greater London, the urban premium is high: the average earnings for a worker in inner London (£49,400) was nearly double that of the average for outer London workers (£26,700) in 2007.
The ways in which density is linked to productivity has been developed in a wide array of research projects. Six key impacts are discussed in this section:
* density allows a higher degree of specialisation, increasing efficiency;
* reduced transport time and costs for products/goods/services from one stage to the next, or from producer to consumer, occurs in denser areas if the transport infrastructure is sufficient;
* increased density increases the prevalence of knowledge spillovers, increasing innovation
* density allows firms to have access to larger markets of suppliers (especially labor supply) and consumers, allowing competition to enhance the quality of inputs and outputs;
* efficiencies of scale are created in denser markets where suppliers are reaching more potential customers;
* reduced land take in denser areas allows more economic activity to take place on a fixed piece of land than less dense designs;
The study also shows that additional doublings of speed can yield growth in excess of 0.3 percent (e.g. quadrupling of speed equals 0.6 percent GDP growth stimulus)
Both broadband availability and speed are strong drivers in an economy. Last year Ericsson and Arthur D. Little concluded that for every 10 percentage point increase in broadband penetration GDP increases by 1 percent.
So a 32 times increase in broadband speed should mean a 1.5% boost in GDP.
A 1000 times increase in broadband speed should mean a 3.0% boost in GDP.
A 1,000,000 times increase in broadband speed should mean a 6.0% boost in GDP.
A 1,000,000,000 times increase in broadband speed should mean a 9.0% boost in GDP.
Terabit per second internet would be about 100,000 times faster than current 10 megabit per second internet and should mean a 5.1% boost in GDP.
Getting to affordable gigabit per second internet as exists in Hong Kong would mean about 2.1% more GDP.
Cities and small countries that have very high GNI per capita now
The list of countries with the highest GNI per capita
NOTE – These have to be adjusted to the 2005 international dollars which means dividing them by about 1.87
1 Monaco 183,150 2009 (about 100,000 in 2005 international dollars)
2 Liechtenstein 137,070 2009
3 Bermuda 133,210 1995
4 Norway 88,890 2011
Comparing countries now
Norway currently is the highest ranked country in terms of human development. They have a 0.955 score.
* life expectancy at birth 81.3 years
* mean years of schooling 12.6 years
* GNI per capita in PPP terms (constant 2005 international $) (Constant 2005 international $) 48,688
Cyprus is about 0.85 or about 0.10 less than Norway.
* Life expectancy at birth (years) 79.8
* Mean years of schooling (of adults) (years) 9.8
* GNI per capita in PPP terms (constant 2005 international $) (Constant 2005 international $) 23,825
About half of GNI per capita and almost 3 years less schooling and 1.5 years less life expectancy.
Croatia was the bottom of the very highly developed category.
* Life expectancy at birth (years) 76.8
* Mean years of schooling (of adults) (years) 9.8
* GNI per capita in PPP terms (constant 2005 international $) (Constant 2005 international $) 15,419
So adding 5 years of life expectancy, 3 years of average schooling, and tripling GNI per capita added 0.15 to the score.
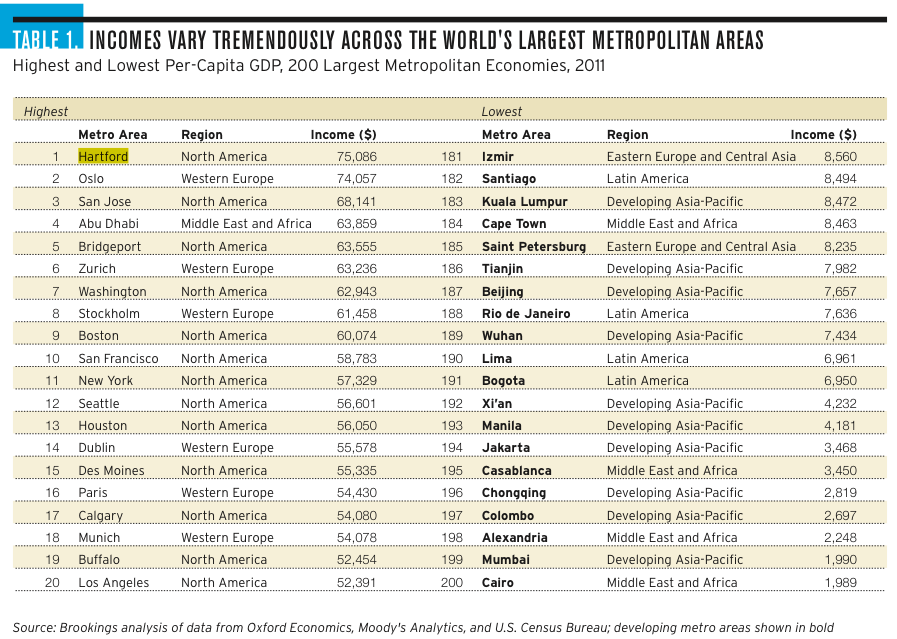
Top GDP per capita of largest 200 cities
If you liked this article, please give it a quick review on ycombinator or StumbleUpon. Thanks

Brian Wang is a Futurist Thought Leader and a popular Science blogger with 1 million readers per month. His blog Nextbigfuture.com is ranked #1 Science News Blog. It covers many disruptive technology and trends including Space, Robotics, Artificial Intelligence, Medicine, Anti-aging Biotechnology, and Nanotechnology.
Known for identifying cutting edge technologies, he is currently a Co-Founder of a startup and fundraiser for high potential early-stage companies. He is the Head of Research for Allocations for deep technology investments and an Angel Investor at Space Angels.
A frequent speaker at corporations, he has been a TEDx speaker, a Singularity University speaker and guest at numerous interviews for radio and podcasts. He is open to public speaking and advising engagements.