

Economists who study productivity, a measure of output per worker, tell us that from around 1994 to 2004 the Internet and advances in computation helped fuel rapid growth. But during the past decade we slid back to far slower improvements in productivity, hence stagnant economic growth. And the phenomenon is showing up in advanced economies around the world, with countries such as Italy and the U.K. particularly hard hit. Many people feel the results as flat or declining wages, and the consequences have almost certainly contributed to deep political unrest in many countries. According to Chad Syverson, an economist at the University of Chicago Booth School of Business, U.S. productivity grew at a mere 1.3 percent per year from 2005 to 2015, far less than the 2.8 percent annual growth rate during the decade earlier. Syverson calculates that had the slowdown not occurred, the gross domestic product would have been $2.7 trillion higher by 2015—about $8,400 for every American.
Policymakers and their partners must adopt a longterm, holistic vision to address those challenges. This requires smart long-term investments in infrastructure and education. But they can earn quicker, easier wins by adopting sound regulation aimed at promoting competition, innovation, and private investment.
We know that crumbling and inferior bridges, roads, education and energy prevent 19th and 20th century economies and technologies from achieving their economic potential.
Likewise not enabling super-reliable higher speed wireless and fiber communication and more precise GPS and 21st century technology savvy population will limit what can be done with 21st century economic potential.
Even some of the strongest proponents of the idea that automation and digital technologies are going to revolutionize our economy are dismayed by the slow progress in implementing these advances.
But robots and other advanced technologies would perform better if wireless communication and GPS location services were rock solid everywhere in a target city and country.
Programming complexity and costs (adding more redundant sensors and systems to handle gaps and problems) go up to handle the not ready for 21st century infrastructure.
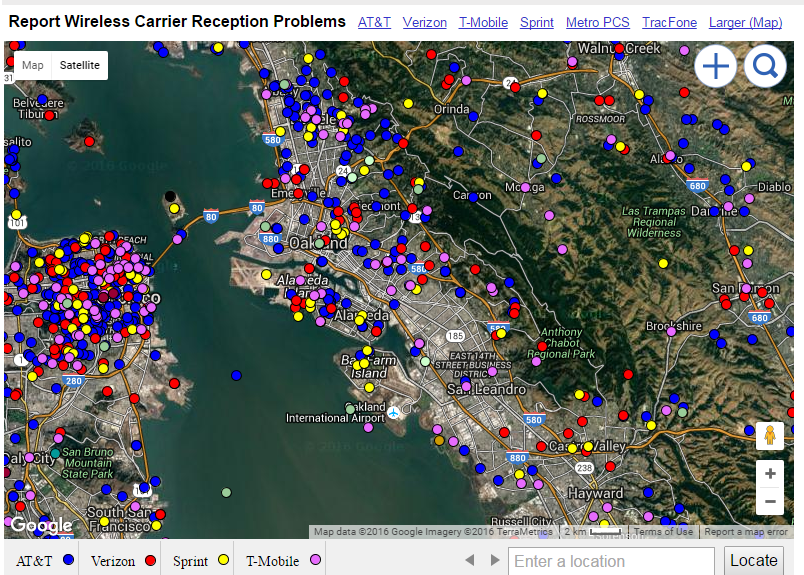
There are deadzones and reception problems even for 3G reception within the San Francisco Bay Area (Which includes silicon Valley). The gaps are worse for 4G. The gaps are super large in the rural areas. T-mobile reception can be better when travelling to foreign cities like Hong Kong or Stockholm than in domestic cities like Oakland.
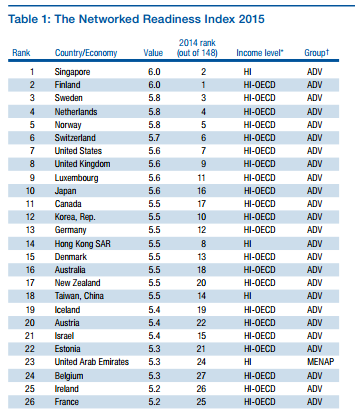
Networked Readiness Index = 25% Environment subindex
+ 25% Readiness subindex
+ 25% Usage subindex
+ 25% Impact subindex
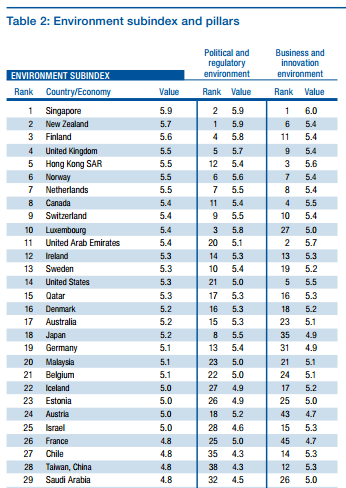
Environment subindex = 1/2 Political and regulatory environment
+ 1/2 Business and innovation environment
1st pillar: Political and regulatory environment
1.01 Effectiveness of law-making bodies
1.02 Laws relating to ICTs
1.03 Judicial independence
1.04 Efficiency of legal system in settling disputes
1.05 Efficiency of legal system in challenging regulations
1.06 Intellectual property protection*
1.07 Software piracy rate, % software installed
1.08 Number of procedures to enforce a contract
1.09 Number of days to enforce a contract
2nd pillar: Business and innovation environment
2.01 Availability of latest technologies
2.02 Venture capital availability
2.03 Total tax rate, % profits
2.04 Number of days to start a business
2.05 Number of procedures to start a business
2.06 Intensity of local competition
2.07 Tertiary education gross enrollment rate, %
2.08 Quality of management schools
2.09 Government procurement of advanced technology products
Readiness subindex = 33% Infrastructure + 33% Affordability + 33% Skills
3rd pillar: Infrastructure
3.01 Electricity production, kWh/capita
3.02 Mobile network coverage, % population
3.03 International Internet bandwidth, kb/s per user
3.04 Secure Internet servers per million population
4th pillar: Affordability
4.01 Prepaid mobile cellular tariffs, PPP $/min.
4.02 Fixed broadband Internet tariffs, PPP $/month
4.03 Internet and telephony sectors competition index, 0–2(best)
5th pillar: Skills
5.01 Quality of educational system
5.02 Quality of math and science education
5.03 Secondary education gross enrollment rate, %
5.04 Adult literacy rate, %
Bandwidth speed plateau
There was fast productivity gains from 1995-2006 when we transitioned from slow (32-64 kbps) and unreliable dialup lines with 5-20 second connection startup times to instant on and faster DSL and cable internet. This continued and speeds increased from 256 Kbps to 5-10 Mbps.
Speeds have pretty much plateaued at 10-100 MBps.
Costs have also stayed at about $50-150 per month for each wired communication service and then $50-150 per month for additional wireless services.
Singapore has high speed internet at $30-100 for 100 MBps to 10 Gbps
Singtel announced commercial deployment of their 10 Gbps Internet service. ‘Next Generation 10 Gigabit Passive Optical Network’ was trialed throughout 2015. The name of the plan is ’10 Gbps Fibre Home Bundle’, and will set you back for S$189 (US $136.13).
If the argument is that this can only be done in cities, then 10 Gbps service should be in every metro area in the world. New York, Chicago, LA, San Francisco Bay area etc…

SOURCES – McKinsey, World Economic Forum, IDA, VRWorld, Technology Review

Brian Wang is a Futurist Thought Leader and a popular Science blogger with 1 million readers per month. His blog Nextbigfuture.com is ranked #1 Science News Blog. It covers many disruptive technology and trends including Space, Robotics, Artificial Intelligence, Medicine, Anti-aging Biotechnology, and Nanotechnology.
Known for identifying cutting edge technologies, he is currently a Co-Founder of a startup and fundraiser for high potential early-stage companies. He is the Head of Research for Allocations for deep technology investments and an Angel Investor at Space Angels.
A frequent speaker at corporations, he has been a TEDx speaker, a Singularity University speaker and guest at numerous interviews for radio and podcasts. He is open to public speaking and advising engagements.