

University of Pennsylvania purchasing power parity tables are available (Penn World Tables 7.0)
Because of China’s population and a degree of uncertainty about the rate of growth of China’s GDP as well as its actual economic size, PWT 7.0 provides two versions, an official and non-official. The former uses the ICP 2005 base estimate of China’s GDP and the national growth rates; version 2 modifies both.
The most important adjustment of China’s PPP for consumption will be of interest to a small group of users and is treated in Part C of the Detailed Documentation. In the end, the PPPs of the basic headings of consumption for household consumption were adjusted upward by 20%.
The modifications of China’s growth rate are based upon earlier work of Angus Maddison and his collaborator Harry Wu; Wu has since updated their work to 2008. Their adjustments also called for an increase in GDP estimates for the sectors of non-material services and agriculture above the official estimates. In 1990, the reference year of Wu’s update, the revision would call for a 5% increase in GDP. Because of the declining importance of agriculture the total adjustment would be about 2% in 2005. This adjustment has not been incorporated into PWT 7.0 in part because it is not clear how it should be distributed on the expenditure side of the accounts. Wu offers a rationale for some additional adjustment of the level of China’s national accounts.
Regional price differences in China are as great or greater than rural-urban differences. Even excluding Beijing, Shanghai, Tianjin and Guangdong, where prices are highest, the range across regions is substantial. For rural areas, Guizhou is 60.6% higher than Chongqing; for urban areas, Hainan is 49.8% higher than Chongqing; and for all areas Hainan is 48.9% higher than Chongqing. The differences make clear why it is difficult to move from urban to national prices in a large country like China.
The average prices in the 11 cities in 2000 in the Brandt-Holz study were 20.5% above national urban prices, both sets of prices weighted by urban populations.
One argument against any adjustment is that many other countries only provide urban prices, so why do something special for China. If one wants to compare China with similar countries in its region that only collect urban prices, say Pakistan, then it may make sense to do no adjustment. But even within Asia-Pacific, India does try to cover the whole country including rural areas and the major regional difference between the South and the North. So making no adjustment for China within Asia-Pacific does not provide the best comparison with India or for that matter, most of the very small countries or larger more affluent countries. Nor the best comparison with countries with higher per capita GDPs and more urbanization, like Brazil.
If the interest is getting the best reading of China’s economy against the G-20, then some adjustment seems appropriate. From the standpoint of PWT 7.0, where we are already offering 2 Chinas, with official and adjusted growth rates, it is simple to also offer users a choice of initial 2005 levels.
Our modification of ICP 2005 for China is to make a downward adjustment of 20% to the price level of C that enters into the PWT estimate for 2005. We arrive at 20% by considering a range of estimates and making what we judge to be a conservative adjustment
PPP estimates for 2009 for the largest countries
China is estimated at 11.3 to 11.6 trillion.
India is estimated at 4.15 trillion.
China has grown by about 20% from 2009 and would be 13.5 to 13.9 trillion.
India has grown by about 16% from 2009 and would be nearly 5 trillion.
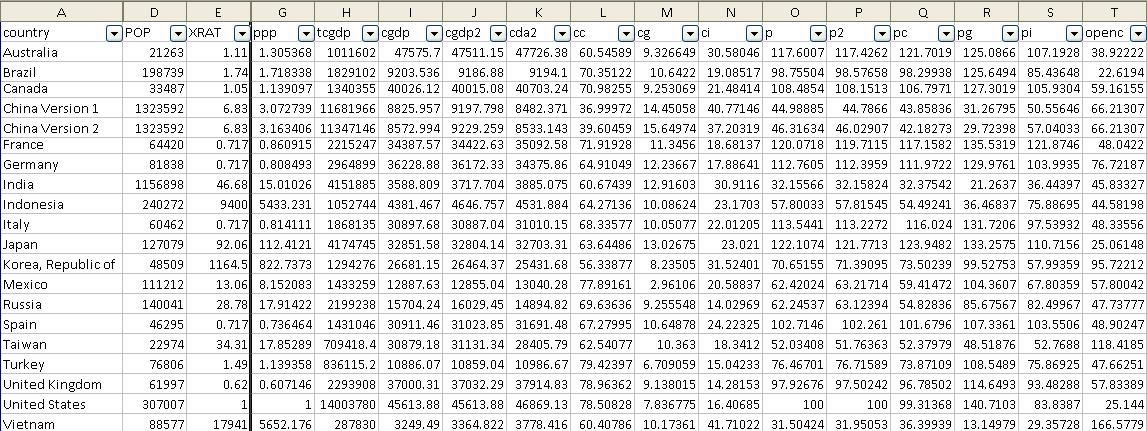
ppp        Purchasing Power Parity over GDP in national currency units per US$
tcgdp      Total Real Gross Domestic Product, current price milions, G-K method
cgdp       Real Gross Domestic Product per Capita, current price G-K method
cgdp2      Real Gross Domestic Product per Capita, current price average GEKS-CPDW
cda2       Domestic Absorption per capita, current price average GEKS-CPDW
cc         Consumption Share of Real Gross Domestic Product per Capita, current price
cg         Government Share of Real Gross Domestic Product per Capita, current price
ci         Investment Share of Real Gross Domestic Product per Capita, current price
p          Price Level of Gross Domestic Product G-K method
p2         Price Level of Gross Domestic Product average of  GEKS-CPDW
pc         Price Level of Consumption
pg         Price Level of Government
pi         Price Level of Investment
openc      Openness in Current Prices
cgnp       Ratio of GNP to GDP

Brian Wang is a Futurist Thought Leader and a popular Science blogger with 1 million readers per month. His blog Nextbigfuture.com is ranked #1 Science News Blog. It covers many disruptive technology and trends including Space, Robotics, Artificial Intelligence, Medicine, Anti-aging Biotechnology, and Nanotechnology.
Known for identifying cutting edge technologies, he is currently a Co-Founder of a startup and fundraiser for high potential early-stage companies. He is the Head of Research for Allocations for deep technology investments and an Angel Investor at Space Angels.
A frequent speaker at corporations, he has been a TEDx speaker, a Singularity University speaker and guest at numerous interviews for radio and podcasts. He is open to public speaking and advising engagements.