
Overall GDP, per capita GDP, and military spending levels are not that great at predicting the actual military capability of a country of the level of actual science and technology capability.
Mexico          1.039 trillion GDP exchange rate 2010 (112 million people)
South Korea     1.007 trillion GDP exchange rate 2010 (48.9 million people)
PPP Countries GDP PPP Population Per Capita PPP
Japan            4.31 trillion (128 million people)   33,828
India            4.06 trillion (1.21 billion people)   3,290
Germany          2.94 trillion (81.7 million people)  35,930
Russia           2.22 trillion (142.9 million people) 15,837
United Kingdom   2.17 trillion (62 million people)    34,920
Brazil           2.17 trillion (191 million people)   11,239
France           2.15 trillion (65.8 million people)  34,077
Italy            1.77 trillion (60.6 million people)  29,400
Mexico           1.63 trillion (112 million people)   14,430
South Korea      1.46 trillion (48.9 million people)  29,836
India is well ahead of Germany, Russia and the UK in PPP GDP. India is massively inferior in terms of military and science and technological contribution. India did start to make significant progress in global contributions in key industries.
Military Expenditures by Country 2009
Country Amount Share of GDP
United States  $687.1 billion  4.7%
China           114.3 billion  2.2%
France           61.3 billion  2.5%
UK               57.4 billion  2.7
Russia           52.6 billion  4.3%
Japan            51.4 billion  1.0%
Germany          46.8 billion  1.4%
Saudi Arabia     42.9 billion 11.2%
Italy            38.2 billion  1.8%
India            34.8 billion  2.8%
Brazil           28.1 billion  1.6%
South Korea      24.3 billion  2.9%
Canada           20.2 billion  1.5%
Australia        19.8 billion  1.9%
Spain            15.8 billion  1.1%
UAE              15.7 billion  7.3%
Turkey           15.6 billion  2.7%
Israel           13.0 billion  6.3%
Netherlands      11.6 billion  1.5%
Greece            9.4 billion  3.2%
Colombia          9.2 billion  3.7%
Taiwan            8.5 billion  2.4%
Poland            8.4 billion  1.8%
Singapore         7.7 billion  4.3%
Iran              7.0 billion  1.8%
Norway            6.3 billion  1.6%
Chile             6.2 billion  3.5%
Indonesia         6.0 billion  0.9%
The UK is currently far more capable of projecting military power than China in spite of China having a higher GDP and more military spending.
Israel clearly has a far more capable military than Canada. Israel has a PPP GDP of 218 billion and a population of 7.65 million. Canada has a GDP 7 times higher and a population over 4 times higher and per capita income that is better and higher military spending.
Saudi Arabia has a higher military budget. The Saudi military consists of over 200,000 active-duty personnel. In 2005 the armed forces had the following personnel: the army, 75,000; Royal Saudi Air Force, 18,000; air defense, 16,000; Royal Saudi Navy, 15,500 (including 3,000 marines); and the SANG had 75,000 active soldiers and 25,000 tribal levies.
The army’s main equipment consists of a combination of French- and U.S.-made armored vehicles: 315 M–1A2 Abrams, 290 AMX–30, and 450 M60A3 main battle tanks; 300 reconnaissance vehicles; 570+ AMX–10P and 400 M–2 Bradley armored infantry fighting vehicles; 3,000+ armored personnel carriers, including the Al-Fahd, produced in Saudi Arabia; 200+ towed artillery pieces; 110 self-propelled artillery pieces; 60 multiple rocket launchers; 400 mortars; 10 surface-to-surface missiles; about 2,000 antitank guided weapons; about 200 rocket launchers; 450 recoilless launchers; 12 attack helicopters; 50+ transport helicopters; and 1,000 surface-to-air missiles
The air force has a fleet of nearly 300 combat aircraft but no armed helicopters. However, its operational capabilities are believed to have fallen considerably since the Gulf War. As of 2006, Saudi Arabia had 291 combat aircraft, but most were nearing obsolete status. The kingdom’s combat aircraft are primarily outdated F–5 models plus British Tornados.
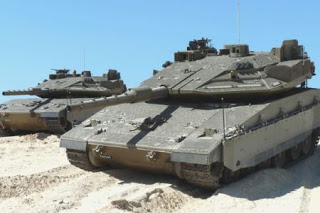
Israel has 83 F15s and 325 F16s in service. Israel has 90 attack helicopters.

Merkeva tank with new Trophy armor that helps protect against anti-tank missiles
Israel has about 1500 tanks.
Canada originally bought 138 “CF-18s” from 1982-1988, but accidents and retirements have reduced the fleet to about 103, with only 79 upgraded F/A-18A/B aircraft still operational. Canada is buying 65 new F-35As and should start getting them starting in about 2017. Estimates of the cost range from $17 billion to $29 billion.
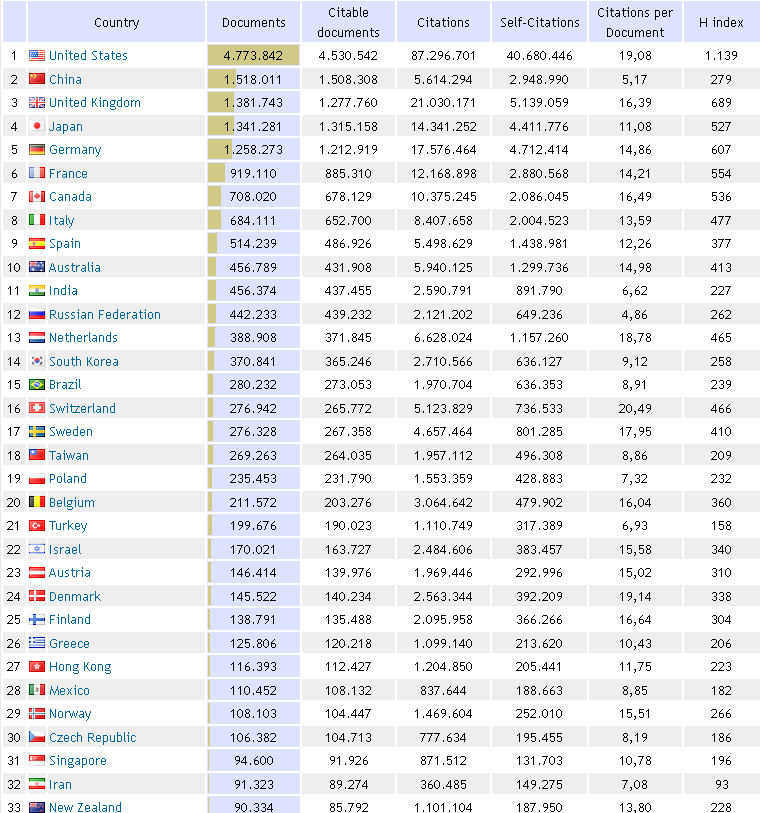
Ranking countries by Science up to 2009
If you liked this article, please give it a quick review on ycombinator or StumbleUpon. Thanks

Brian Wang is a Futurist Thought Leader and a popular Science blogger with 1 million readers per month. His blog Nextbigfuture.com is ranked #1 Science News Blog. It covers many disruptive technology and trends including Space, Robotics, Artificial Intelligence, Medicine, Anti-aging Biotechnology, and Nanotechnology.
Known for identifying cutting edge technologies, he is currently a Co-Founder of a startup and fundraiser for high potential early-stage companies. He is the Head of Research for Allocations for deep technology investments and an Angel Investor at Space Angels.
A frequent speaker at corporations, he has been a TEDx speaker, a Singularity University speaker and guest at numerous interviews for radio and podcasts. He is open to public speaking and advising engagements.