

In terms of urban GDP growth from 2007-2025 by country
1. China        17.1 trillion
2. USA           5.9 trillion
3. India         2.0 trillion
4. Brazil        1.5 trillion
5. Mexico        0.87 trillion
6. S. Korea      0.82 trillion
7. Russia        0.68 trillion
8. UK            0.62 trillion
9. Taiwan        0.59 trillion
10. Turkey       0.53 trillion
11. Germany      0.52 trillion
12. Indonesia    0.50 trillion
Mexico and South Korea are ahead of the projections for Russia. South Korea is considered a developed country as of 1997.
Mexico is still considered to be developing and is expected to have 4-5% GDP growth for the next several years and a growing population.
Economywatch has a projection for Mexico in 2015
GDP Per Capita (Current Prices, National Currency)   MXN 163,522.36
GDP Per Capita (Current Prices, US Dollars)          US$ 11,812.75
GDP (PPP), US Dollars                                US$ 2,067.17 Billion
GDP Per Capita (PPP), US Dollars                     US$ 18,106.37
GDP Share of World Total (PPP)                       2.116 %
Implied PPP Conversion Rate                          9.03
Unemployment Rate (% of Labour Force)                3.5 %
Population                                           114.17 Million
Economywatch has a projection for Russia in 2015
GDP Per Capita (Current Prices, National Currency)   RUB 548,854.02 .
GDP Per Capita (Current Prices, US Dollars)          US$ 18,110.77
GDP (PPP), US Dollars                                US$ 2,944.11 Billion
GDP Per Capita (PPP), US Dollars                     US$ 21,336.76
GDP Share of World Total (PPP)                       2.969 %
Implied PPP Conversion Rate                          25.723
Unemployment Rate (% of Labour Force)                7 %
Population                                           138.0 Million
Oil and gas are 25% of the Russian economy now. Oil and gas is less than 10% of Mexico’s economy.
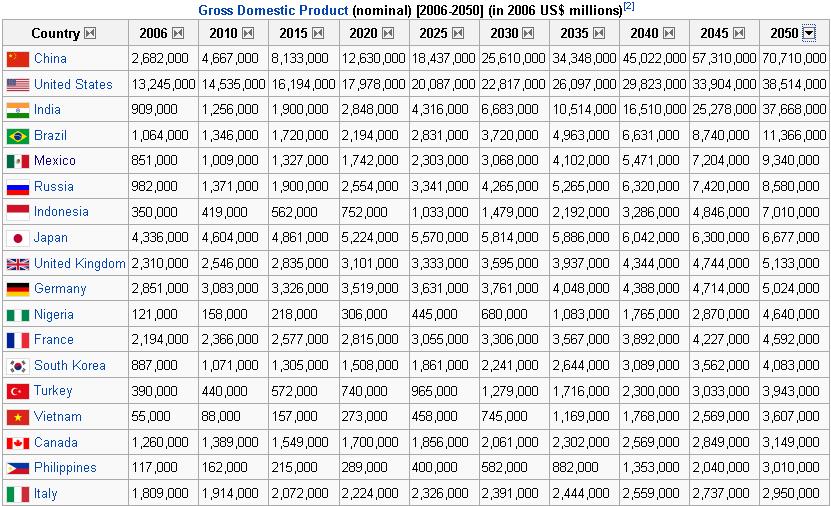
A Goldman Sach’s forecast for 2050 has Mexico ahead of Russia in GDP
By 2025, India should have joined China with a clear separation from Brazil in terms of size of its economy.
China and India (CI) should be in their own category of emerging markets.
Brazil, Mexico, Russia and Indonesia would be a second tier.
Developed versus Developing
Economies were divided according to 2008 GNI per capita using the following ranges of income:
Low income countries had GNI per capita of US$975 or less.
Lower middle income countries had GNI per capita between US$976 and US$3,855.
Upper middle income countries had GNI per capita between US$3,856 and US$11,905.
High income countries had GNI above US$11,906.
Having a GNI above $11,906 tends to classify a country as developed.
The IMF uses a flexible classification system that considers
(1) per capita income level,
(2) export diversification—so oil exporters that have high per capita GDP would not make the advanced classification because around 70% of its exports are oil, and
(3) degree of integration into the global financial system.
If you liked this article, please give it a quick review on ycombinator or StumbleUpon. Thanks

Brian Wang is a Futurist Thought Leader and a popular Science blogger with 1 million readers per month. His blog Nextbigfuture.com is ranked #1 Science News Blog. It covers many disruptive technology and trends including Space, Robotics, Artificial Intelligence, Medicine, Anti-aging Biotechnology, and Nanotechnology.
Known for identifying cutting edge technologies, he is currently a Co-Founder of a startup and fundraiser for high potential early-stage companies. He is the Head of Research for Allocations for deep technology investments and an Angel Investor at Space Angels.
A frequent speaker at corporations, he has been a TEDx speaker, a Singularity University speaker and guest at numerous interviews for radio and podcasts. He is open to public speaking and advising engagements.