

The Tax Policy Center has updated its figures on the income distribution in America.
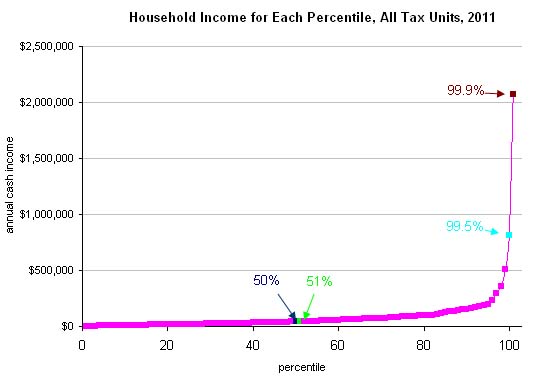
For all tax units:
to be in the top 1% your household has to earn $506,553 or more.
the top 2% earn $360,435 or more
the top 3% earn $290,860 or more
the top 0.5% earn $815,868 or more
the top 0.1% earn $2,070,574 or more
For joint filers:
to be in the top 1% your household has to earn $761,938 or more.
the top 2% earn $477,128 or more
the top 3% earn $391,010 or more
the top 0.5% earn $1,096,732 or more
the top 0.1% earn $2,998,714 or more
Below is the chart for the top 20% and the bottom 20%.

The US census Income, Poverty, and Health Insurance Coverage in the United States: 2010 This report has historical data on income at various percentile rankings, but their top category is the 95th percentile. The 95th percentile of income has been about 180,000 in the 2000 to 2010 period.
Here is an older analysis of income distribution from 2004, which looks at total income by category.
If you liked this article, please give it a quick review on ycombinator or StumbleUpon. Thanks

Brian Wang is a Futurist Thought Leader and a popular Science blogger with 1 million readers per month. His blog Nextbigfuture.com is ranked #1 Science News Blog. It covers many disruptive technology and trends including Space, Robotics, Artificial Intelligence, Medicine, Anti-aging Biotechnology, and Nanotechnology.
Known for identifying cutting edge technologies, he is currently a Co-Founder of a startup and fundraiser for high potential early-stage companies. He is the Head of Research for Allocations for deep technology investments and an Angel Investor at Space Angels.
A frequent speaker at corporations, he has been a TEDx speaker, a Singularity University speaker and guest at numerous interviews for radio and podcasts. He is open to public speaking and advising engagements.