

This is an update of air pollution from coal plants in the United States.

Map of coal power by state. Note: about of third of the air pollution can go thousands of miles from the plant. There is more impact on air quality and health of those near the plants. Air pollution has been improved in the USA since the 1950s and 1960s. There is still a negative effect. 24,000 coal impacted deaths and a total of 60,000 air pollution impacted deaths out of 2.5 million deaths from any cause. Cigarette smoking and obesity have larger negative effects, which is seen in West Virginia’s health statistics. The bad air pollution states are ending up at or near the bottom of state health rankings.
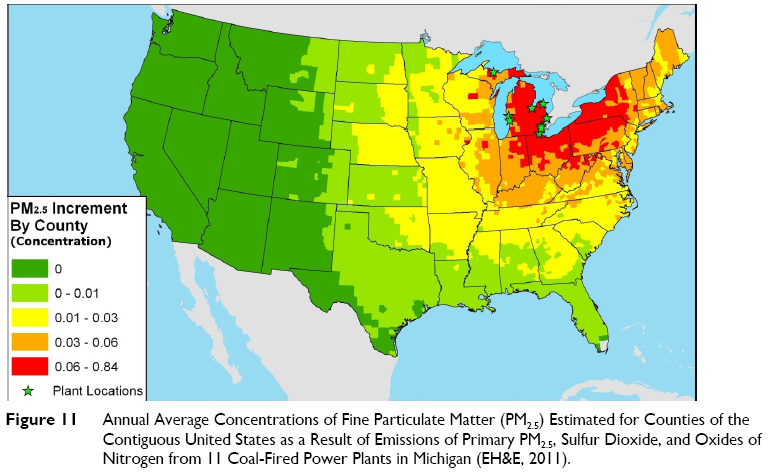
The incremental particulate matter from 11 coal plants in Michigan

PM2.5 is 10-12% from coal power plants. So it is not the whole problem but eliminating that pollution source would improve health and save lives.
Analysis of PM10 by metro statistical area.
Source watch has a list of the states with the most coal power plants
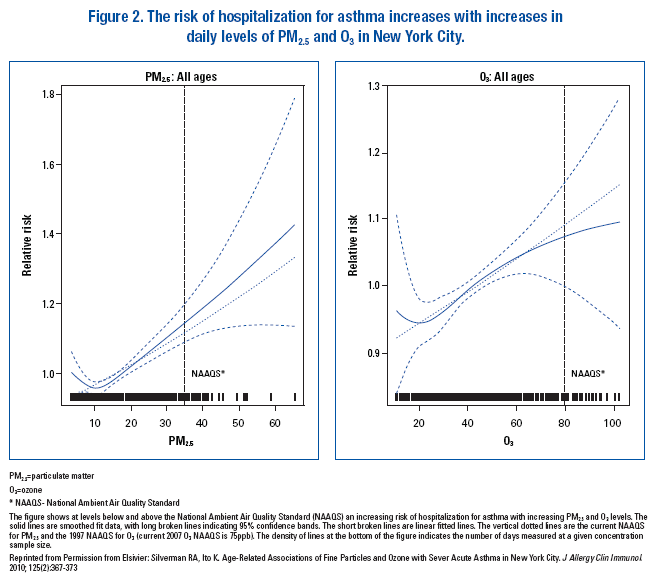
Rank State # of Plants Total Capacity 2005 Power Prod.
1    Texas          20   21,238 MW      148,759 GWh
2    Ohio           35   23,823 MW      137,457 GWh
3    Indiana        31   21,551 MW      123,985 GWh
4    Pennsylvania   40   20,475 MW      122,093 GWh
5    Illinois       32   17,565 MW       92,772 GWh
6    Kentucky       21   16,510 MW       92,613 GWh
7    West Virginia  19   15,372 MW       91,601 GWh
8    Georgia        16   14,594 MW       87,624 GWh
9    North Carolina 25   13,279 MW       78,854 GWh
10   Missouri       24   11,810 MW       77,714 GWh
11   Michigan       33   12,891 MW       71,871 GWh
12   Alabama        11   12,684 MW       70,144 GWh
13   Florida        15   11,382 MW       66,378 GWh
14   Tennessee      13   10,290 MW       59,264 GWh
15   Wyoming        10   6,168 MW        43,421 GWh
16   Wisconsin      28   7,116 MW        41,675 GWh
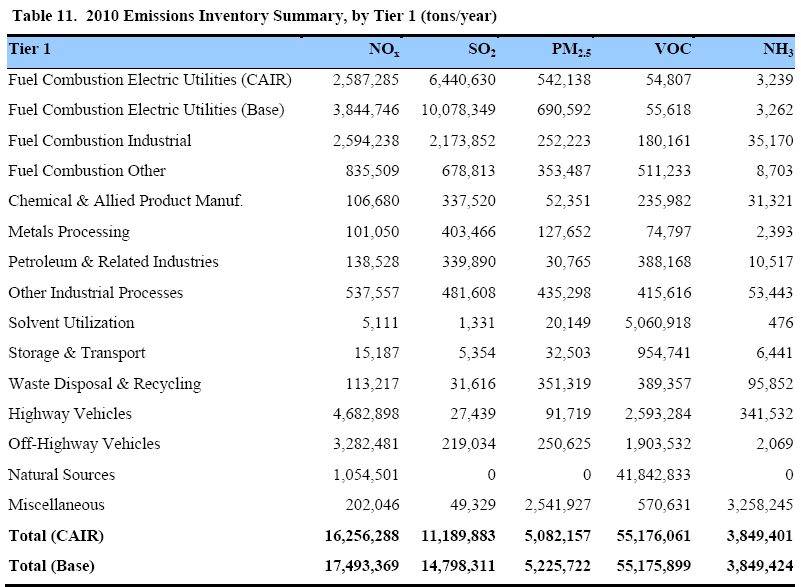
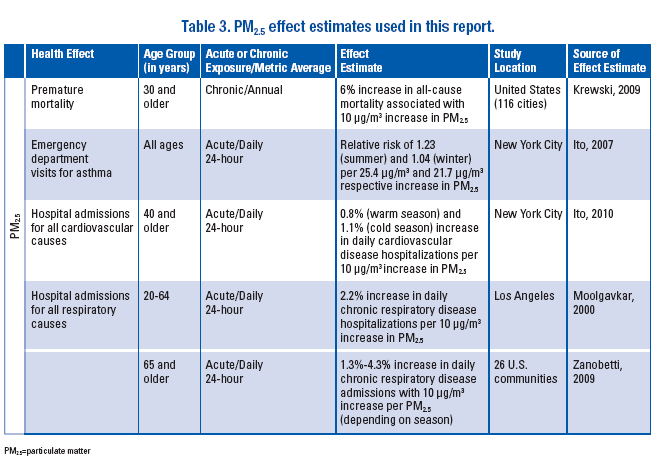
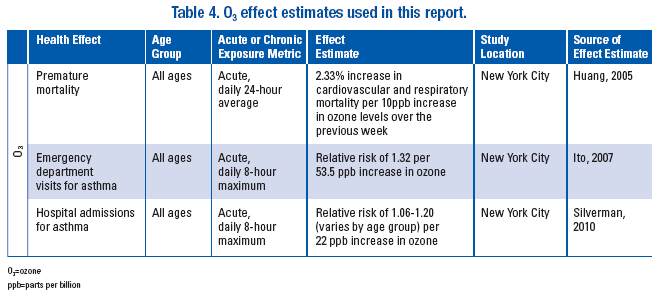
Daily hospitalizations in New York correlated to increased PM2.5 and Ozone pollution.
Hospitalizations for asthma increase by 1.4 times for older populations with worse PM2.5 and ozone. Daily measurements of hospitalization and air pollution levels.
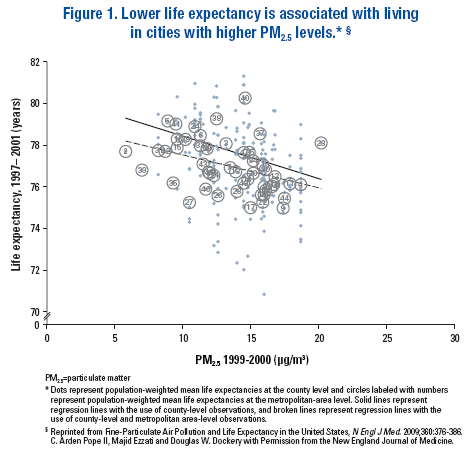
Cities with worse PM2.5 have people with lower life expectancy. This shows that improving by 10% on PM2.5 would save lives and improve public health.

Over 100 pages on how the powerplant health impacts are calculated.
Sourcewatch on particulates and coal
Air pollution from US coal fired power plants.
NRDC methodology documentation
Satellite mapping of PM2.5 air pollution in China

Annual-average population-weighted fine particulate matter concentrations (PM 2.5) for Chinese provinces in 2007. Measured by Aura Satellite.

Brian Wang is a Futurist Thought Leader and a popular Science blogger with 1 million readers per month. His blog Nextbigfuture.com is ranked #1 Science News Blog. It covers many disruptive technology and trends including Space, Robotics, Artificial Intelligence, Medicine, Anti-aging Biotechnology, and Nanotechnology.
Known for identifying cutting edge technologies, he is currently a Co-Founder of a startup and fundraiser for high potential early-stage companies. He is the Head of Research for Allocations for deep technology investments and an Angel Investor at Space Angels.
A frequent speaker at corporations, he has been a TEDx speaker, a Singularity University speaker and guest at numerous interviews for radio and podcasts. He is open to public speaking and advising engagements.