

World Bank poverty statistics are based upon flawed purchasing power parity numbers. There is real poverty in the world but the poverty statistics likely have been substantially overstating the poverty levels for ten years.
Taking the bank’s 2012 figures at face value also implies that we have to believe the following:
* North Korea has roughly the same poverty rate as China.
* Individual consumption in India has grown at a paltry 1.5 percent per year since the country’s economic takeoff in the early 1990s, and the much vaunted Indian middle class only numbers 9 million people—in a country with over 900 million cell phone subscribers and 40 million cars.
* In 1981, China was poorer than any country in the world is today, with a level of individual consumption below the current level in Liberia.
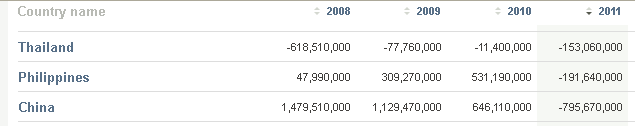
China received over one billion dollars in aid until 2009. In 2011, China started giving out more development aid. China would not have a reason to suppress its purchasing power parity numbers. Some in China could get the free money from 2000 to 2010 while other parts were adding trillions to the overall economy.
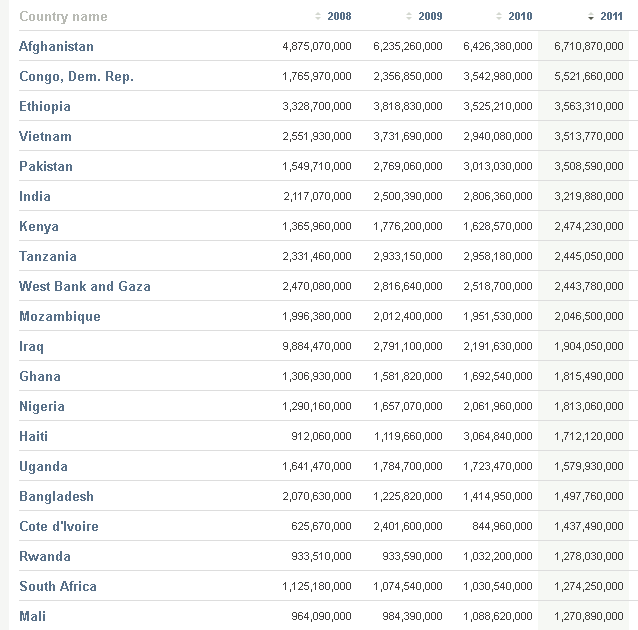
According to the Development Assistance Committee, a consortium of the world’s main donors, the developed world gave nearly $120 billion in assistance to the developing world in 2009, or 0.32 percent.
In 2012, India approved development projects in Afghanistan to the tune of $100 million as part of India’s $2 billion aid package to the war-torn country. In 2010, India extended a $1 billion line of credit to Bangladesh, the highest ever one-time assistance, and last year, it offered $5 billion in credit to African nations.
India has had some success with its welfare programs, but it spends only 0.9 percent of gross domestic product on health care, among the lowest in the world, and 3 percent on education.
Britain’s decided to stop giving development aid to India by 2015.
Global humanitarian aid report
First, it is impossible to say anything meaningful about poverty in a country without having a household survey to explain how income (or consumption) is distributed among its people. The World Bank gets around this by making the assumption that any country with no survey has the same poverty rate as the average for its region. This leads to the peculiar result of North Korea being assigned essentially the same poverty rate as China, from whom it regularly receives food aid.
The increased coverage of surveys flatters to deceive. Of the 49 countries in sub-Saharan Africa, a seemingly credible 43 have a survey. Yet only half of these countries have undertaken a new survey in the past six years. Of the 386 million people who are estimated to live on under $1.25 a day in the region, a third are derived by extrapolating from surveys dating from 2005 (the year of the bank’s last global poverty estimate) or earlier.
Second, surveys need to be reasonably accurate and representative if they are to be used as a basis for estimating poverty. However, the World Bank uses household surveys as an article of faith, even when the data is at odds with other sources of information.
India’s data
The case of India is the most famous and widely studied, and also the most important for global poverty numbers by virtue of India’s population size. Survey numbers suggest that the average Indian consumed $720 per year in 2010, while the country’s national income accounts indicate that household expenditure was about two-and-a-half times greater, at $1,673 per person per year. As one might expect, such a discrepancy has dramatic implications for India’s poverty estimates—a difference in the order of hundreds of millions of people.
Which figure should be believed? Relying blindly on survey data, the World Bank must conclude that growth in India’s household expenditure per capita has been only 1.5 percent per year since the country embarked on its celebrated economic reform program in the early 1990s. This also implies hardly any acceleration from India’s pre-reform period when surveys reported an equivalent growth rate of 1.1 percent.
By contrast, the corresponding data from national accounts have household expenditure per capita averaging 4.5 percent growth a year over the past two decades, and show a clear break from the period before the reforms when it averaged 1.6 percent a year. The survey data not only deny the impact of India’s economic reforms, but reject the existence of an emergent middle class. According to the survey, less than 1 percent of Indians make it into the ranks of the global middle class, with consumption above $10 a day.
There even seem to be discrepancies within the survey data itself. Survey data show that meat consumption in rural India has grown at a rate of 4.8 percent a year since just prior to the reforms, while fruit and vegetable consumption grew by 3.2 percent. These trends do not seem compatible with overall consumption growing at 1.5 percent per year.
China’s Data
The World Bank’s global poverty estimates extend over nearly three decades, with its earliest estimates provided for the year 1981. Throughout this period, the global headcount (based on the $1.25 poverty line) has been dominated by three population groups: Sub-Saharan Africa, India and China. These three account for a remarkably constant three-quarters of the world’s poor—a share which has never deviated by more than three percentage points on either side. Yet poverty estimates for each of the three suffer from glaring problems: insufficient survey data, flawed surveys, and faulty PPP conversions, respectively. If we cannot believe the poverty estimates for Sub-Saharan Africa, India and China, then we cannot believe the World Bank’s global estimates, and we must admit that our knowledge of the state of global poverty is glaringly limited.
If you liked this article, please give it a quick review on ycombinator or StumbleUpon. Thanks

Brian Wang is a Futurist Thought Leader and a popular Science blogger with 1 million readers per month. His blog Nextbigfuture.com is ranked #1 Science News Blog. It covers many disruptive technology and trends including Space, Robotics, Artificial Intelligence, Medicine, Anti-aging Biotechnology, and Nanotechnology.
Known for identifying cutting edge technologies, he is currently a Co-Founder of a startup and fundraiser for high potential early-stage companies. He is the Head of Research for Allocations for deep technology investments and an Angel Investor at Space Angels.
A frequent speaker at corporations, he has been a TEDx speaker, a Singularity University speaker and guest at numerous interviews for radio and podcasts. He is open to public speaking and advising engagements.