

China is still enjoying strong growth – 6.6 percent in 2016- as it shifts from investment to consumption and industry to services, but the country needs faster progress on structural reforms to boost medium-term growth and reduce risks, the IMF said in its latest annual assessment of the economy.
China continues its transition to sustainable growth, with progress on many fronts yet also many challenges. Growth slowed to 6.9 percent in 2015 and is projected to moderate to 6.6 percent this year owing to slower private investment and weak external demand.
Inflation dipped below 1.5 percent in 2015 and is expected to pick up to around 2 percent this year, reflecting the rebound in commodity prices and the exchange rate depreciation since mid-2015.
Infrastructure spending picked up and credit growth accelerated in the second half of 2015. Accommodative macro policies are projected to continue supporting activity over the remainder of 2016.
China adopted a new five-year plan (2016-20), centered on rebalancing the economy. It aims to boost consumption, expand the service sector, protect the environment, further open up the economy, expand public services, and reduce poverty. The government has also announced elements of a reform plan for SOEs and capacity reduction targets in the coal and steel sectors (10–15 percent of existing capacity over the next 3‒5 years), together with a RMB 100 billion restructuring fund to re-employ and resettle an expected 1.8 million affected workers. However, in many areas, especially SOE reform, more details and guidelines are awaited.
China’s economic growth will continue to slow for the next five years and will fall below 6 percent in 2020, the International Monetary Fund (IMF) forecasted. The IMF has a 98 page report on China’s economy


Economists have long disputed the accuracy of China’s official economic data, but agree its economy has steadily slowed since growth above 10 percent was reported in 2010.
Despite the slowdown, China’s growth outlook remains far higher than for advanced economies and many emerging ones. The IMF sees the world averaging economic growth of just 3.1 percent in 2016 and 3.4 percent in 2017.
China imports down a lot
Chinese imports have slowed significantly over the past two years in real terms. Weaker investment, partly due to progress in rebalancing from investment to consumption, accounts for about 40–50 percent of this slowdown. Weaker exports also account for about 40 percent of slowdown, of which about a quarter is due to stronger RMB.
The sharp decline in nominal imports has been largely due to prices. In 2015, goods imports were down 9½ percent in RMB nominal terms, mostly driven by lower import prices, of which two thirds is due to the sharp fall in commodity prices (which alone improves the trade balance by about 1½ percent of GDP). Real imports were up by only 1 percent (compared to about 9 percent on average over the previous three years), accounting for about half of the deceleration in real imports globally.
The weakness in goods imports is broad based. Machinery and transport imports (accounting for about 40 percent of total imports) are decelerating as re-export demand is falling and rebalancing away from investment-based growth continues. Electronics is relatively more resilient. Commodities (accounting for about 30 percent of total imports) have also decelerated as a result of the slowdown in industry and weak real estate and infrastructure investment.

Several factors have contributed to the slowdown in real imports. Overall domestic demand has moderated after the strong surge following the fiscal stimulus in response to the global financial crisis.
The economy is undergoing structural change to a model driven increasingly by consumption, with lower import intensity than investment and exports. China has also been substituting imports of higher value-added products with its own production. In addition, sizable currency appreciation has eroded price competitiveness of exports, and thus lowered demand for processing imports.
Vulnerabilities and weaknesses

* China has weakening corporate fundamentals
* China has High and rising credit growth
* China has an increasingly large, leveraged, interconnected, and opaque financial system
* China has capital outflows.
Despite the relatively benign near-term outlook, downside risks dominate
Near term Downside: the key risks are a loss of investor confidence, disorderly corporate defaults, a sharp fall in asset prices, and a quicker fading of the stimulus impact. With high leverage, corporates are especially sensitive to declines in profitability and higher borrowing costs
Medium term Downside : the key risk is slow progress on reform and continued reliance on policy stimulus and unsustainable credit growth, which would add to vulnerabilities, worsen resource misallocation, and lead to permanently lower growth. While near-term growth will be temporarily boosted, medium-term growth would continuously fall under an illustrative “no-reform” scenario, reflecting a sustained TFP growth slowdown. The nonfinancial private credit/GDP ratio would rise significantly higher than under the baseline, as would the risk of a disruptive adjustment.
Upside Near term: the stimulus may have a bigger and more sustained impact, with a larger pick-up in real estate and a slower reduction in overcapacity investment (though this would increase medium-term risks).
Upside Medium term: Faster progress on enacting structural reform (especially SOE reform), curbing credit growth, and improving overall resource efficiency would lift medium-term growth prospects. Under an illustrative “proactive” scenario, near-term growth could dip to 6 percent reflecting the faster adjustment partially offset by high-quality fiscal support (without such support, growth would fall to about 5½ percent), while medium-term growth would rise to 6½ percent driven by higher TFP growth. The improved efficiency would reduce credit intensity further, and stabilize the nonfinancial private debt/GDP ratio by 2021 significantly lower compared to the baseline. The pace of rebalancing from investment to consumption would also be faster.

China’s transition will be positive overall for the global economy, but continue to produce large spillovers that vary by country/region.
China will continue to drive global growth during its transition. Despite its growth slowing, China doubled its real GDP since 2009, thus continuing to account for about a third of global growth in 2015 (more than it did in 2010 when China was growing in double digits).

The evolution of China’s production mix is already creating opportunities for frontier and developing economies. Staff analysis shows that China’s movement up the value chain with its wages rising has led China to exit some lower-end, more labor-intensive sectors. This trend is creating opportunities for frontier and developing economies, particularly in Asia (e.g., Cambodia, Lao P.D.R, Myanmar, and Vietnam) to enter those sectors and to satisfy rising Chinese consumption demand.

China is a major importer across a range of commodities, especially metals, where it accounted for about 40 percent of global demand in 2014. China’s investment slowdown has had a significant impact on the demand for, and prices of, commodities closely related to investment activities. Staff analysis suggests that China’s rebalancing might account for between a fifth and a half of the declines in broad commodity price indices, with marked difference across commodities.
A 1 percentage point investment-driven drop in China’s output growth would reduce G20 growth by ¼ percentage point.
Overall, countries most heavily exposed to China’s growth slowdown are those within the Asian regional supply chain and heavy commodity and machinery exporters.
Nominal Growth Key to Policy
Nominal vs. Real GDP, and the GDP Deflator. The main difference between nominal and real values is that real values are adjusted for inflation, while nominal values are not. As a result, nominal GDP will often appear higher than real GDP.
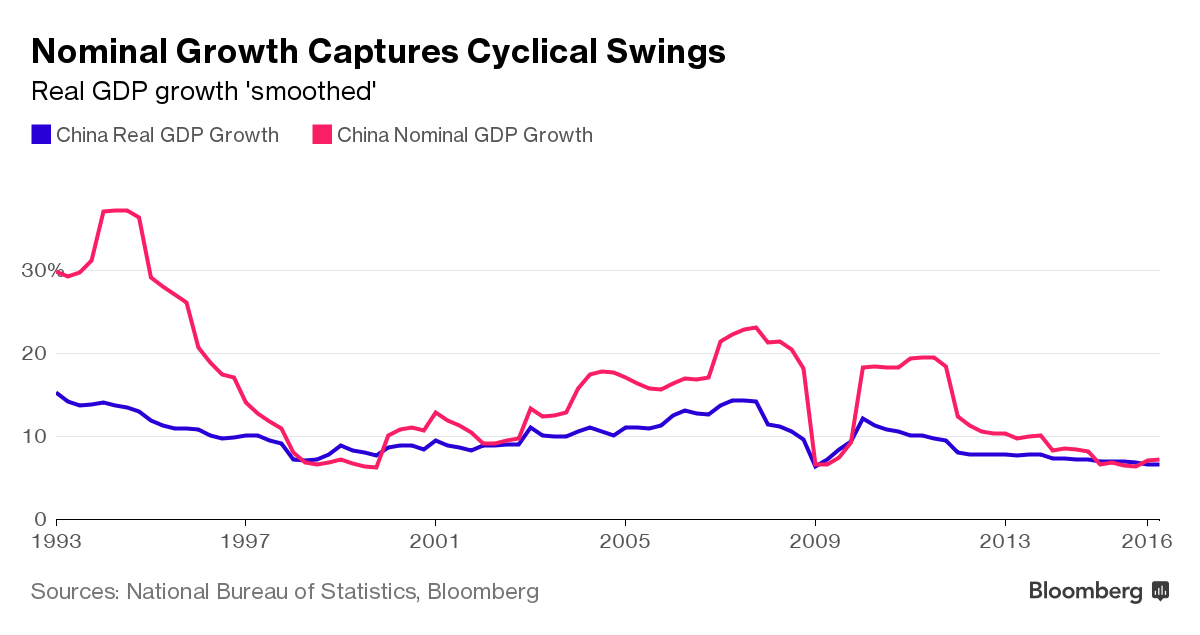
Right now nominal growth indicates there isn’t a burning need for full-blown policy easing. The upturn in nominal expansion may last until the second quarter of 2017.
China Debt Forecast

SOURCE – IMF, Bloomberg

Brian Wang is a Futurist Thought Leader and a popular Science blogger with 1 million readers per month. His blog Nextbigfuture.com is ranked #1 Science News Blog. It covers many disruptive technology and trends including Space, Robotics, Artificial Intelligence, Medicine, Anti-aging Biotechnology, and Nanotechnology.
Known for identifying cutting edge technologies, he is currently a Co-Founder of a startup and fundraiser for high potential early-stage companies. He is the Head of Research for Allocations for deep technology investments and an Angel Investor at Space Angels.
A frequent speaker at corporations, he has been a TEDx speaker, a Singularity University speaker and guest at numerous interviews for radio and podcasts. He is open to public speaking and advising engagements.