

IMF has projected GDP and GDP per capita out to about 2021.
China has 60% of the US economy on a nominal basis in 2016. China would need 65% more overall nominal economic growth or a stronger currency to catchup to the overall US economy on a nominal basis.
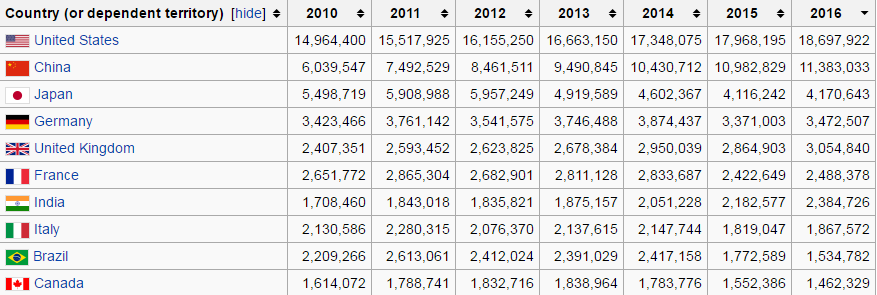
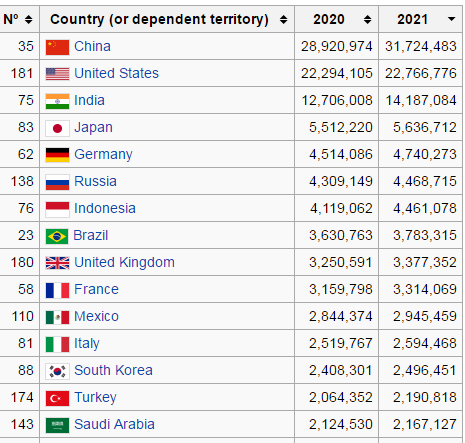
China is ahead on a purchasing power parity basis.

By 2021, on a purchasing power parity basis China’s economy will be 50% larger than the US economy.
In terms of per capita GDP, Europe and Japan are falling to about 60% of the nominal US per capita level which is down from about 70-75%. Japan is heading down to about half the US gdp per capita level.
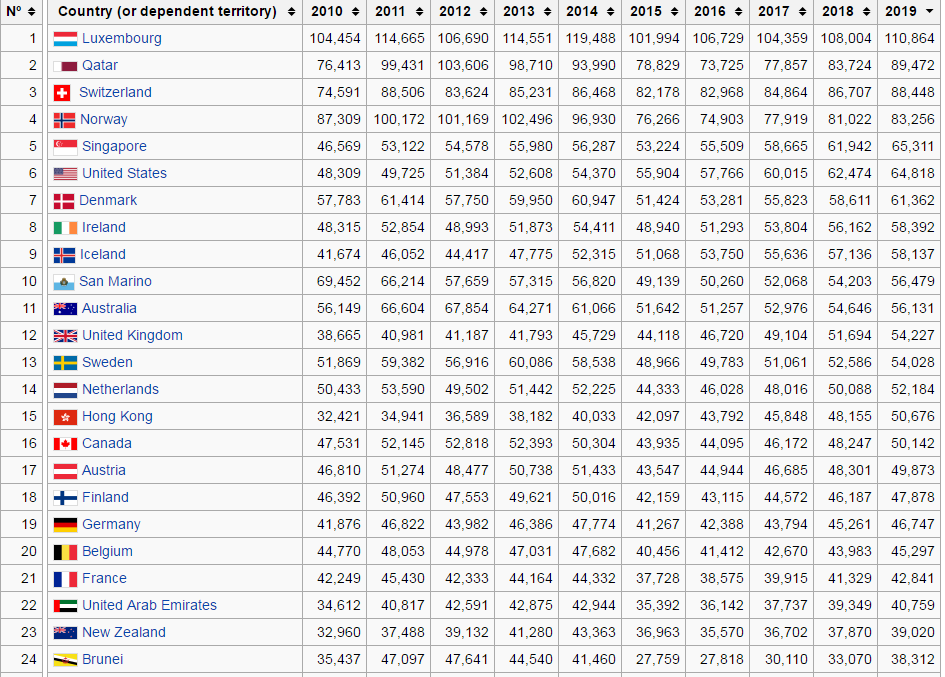

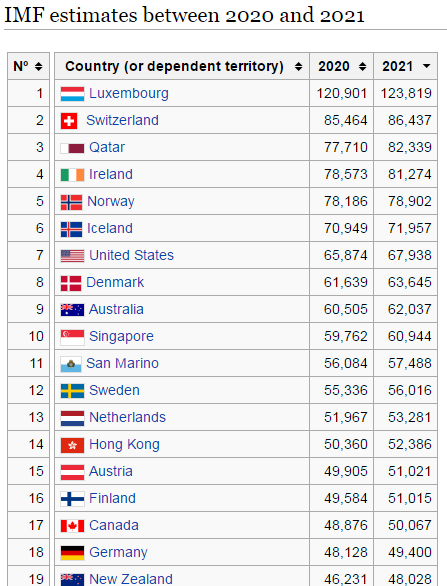
If the IMF projections for China per capita income held up then sometime around 2022-2024 China’s per capita income would pass into the high income country level.
The Atlas method is a method used by the World Bank to estimate the size of economies in terms of gross national income (GNI) in U.S. dollars. … The resulting GNI in U.S. dollars is divided by the country’s midyear population to obtain the GNI per capita. They use the average of three year of currency exchange rates.
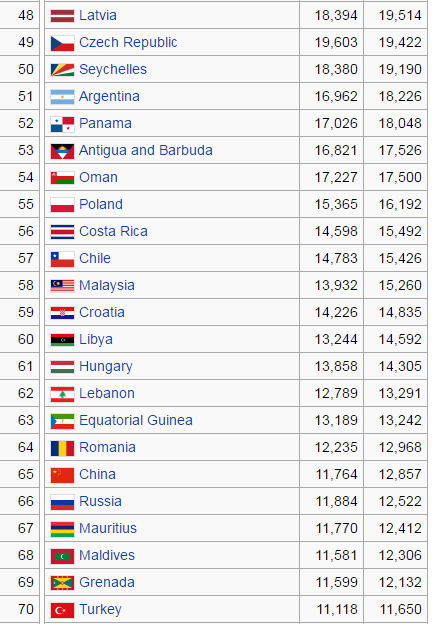
World Bank List Of Economies By Income Group (FY2015)
In this classification, countries are divided in the following income groups:
Group 1 | Low income: $1,045 or less
Group 2 | Lower middle income: $1,046 to $4,125
Group 3 | Upper middle income: $4,126 to $12,745
Group 4 | High income: $12,746 or more
China is currently classed as upper middle income with about $7820 per capita GNI in 2015. In 2021, on a per capita nominal basis China would pass into the high income class but this will be delayed because of inflation adjustment.
India is currently low middle income with $1590 per capita GNI in 2015.
The Center for International Development at Harvard University (CID) use their newly updated measure of economic complexity, which captures the diversity and sophistication of productive capabilities embedded in a country’s exports, to generate the growth projections. The projections reflect the latest 2014 trade data available. The global landscape for economic growth that results shows greatest potential for rapid growth in South Asia and East Africa. Conversely, oil economies and other commodity-driven economies face the slowest growth outlook. India tops the global list for predicted annual growth rate for the coming decade, at 7.0 percent. This far outpaces projections for its northern neighbor and economic rival, China, which the researchers expect to face a continued slowdown to 4.3 percent growth annually to 2024. However 7% growth for India would fall far short of the 10% India gdp growth target which India needs to catchup to other economies and to lift many Indians out of poverty.
China should still pick up about 20-25% on the US economy out to 2024 per the Harvard projections.


Brian Wang is a Futurist Thought Leader and a popular Science blogger with 1 million readers per month. His blog Nextbigfuture.com is ranked #1 Science News Blog. It covers many disruptive technology and trends including Space, Robotics, Artificial Intelligence, Medicine, Anti-aging Biotechnology, and Nanotechnology.
Known for identifying cutting edge technologies, he is currently a Co-Founder of a startup and fundraiser for high potential early-stage companies. He is the Head of Research for Allocations for deep technology investments and an Angel Investor at Space Angels.
A frequent speaker at corporations, he has been a TEDx speaker, a Singularity University speaker and guest at numerous interviews for radio and podcasts. He is open to public speaking and advising engagements.
Comments are closed.