

The world is currently at about 403.74 parts per million CO2.
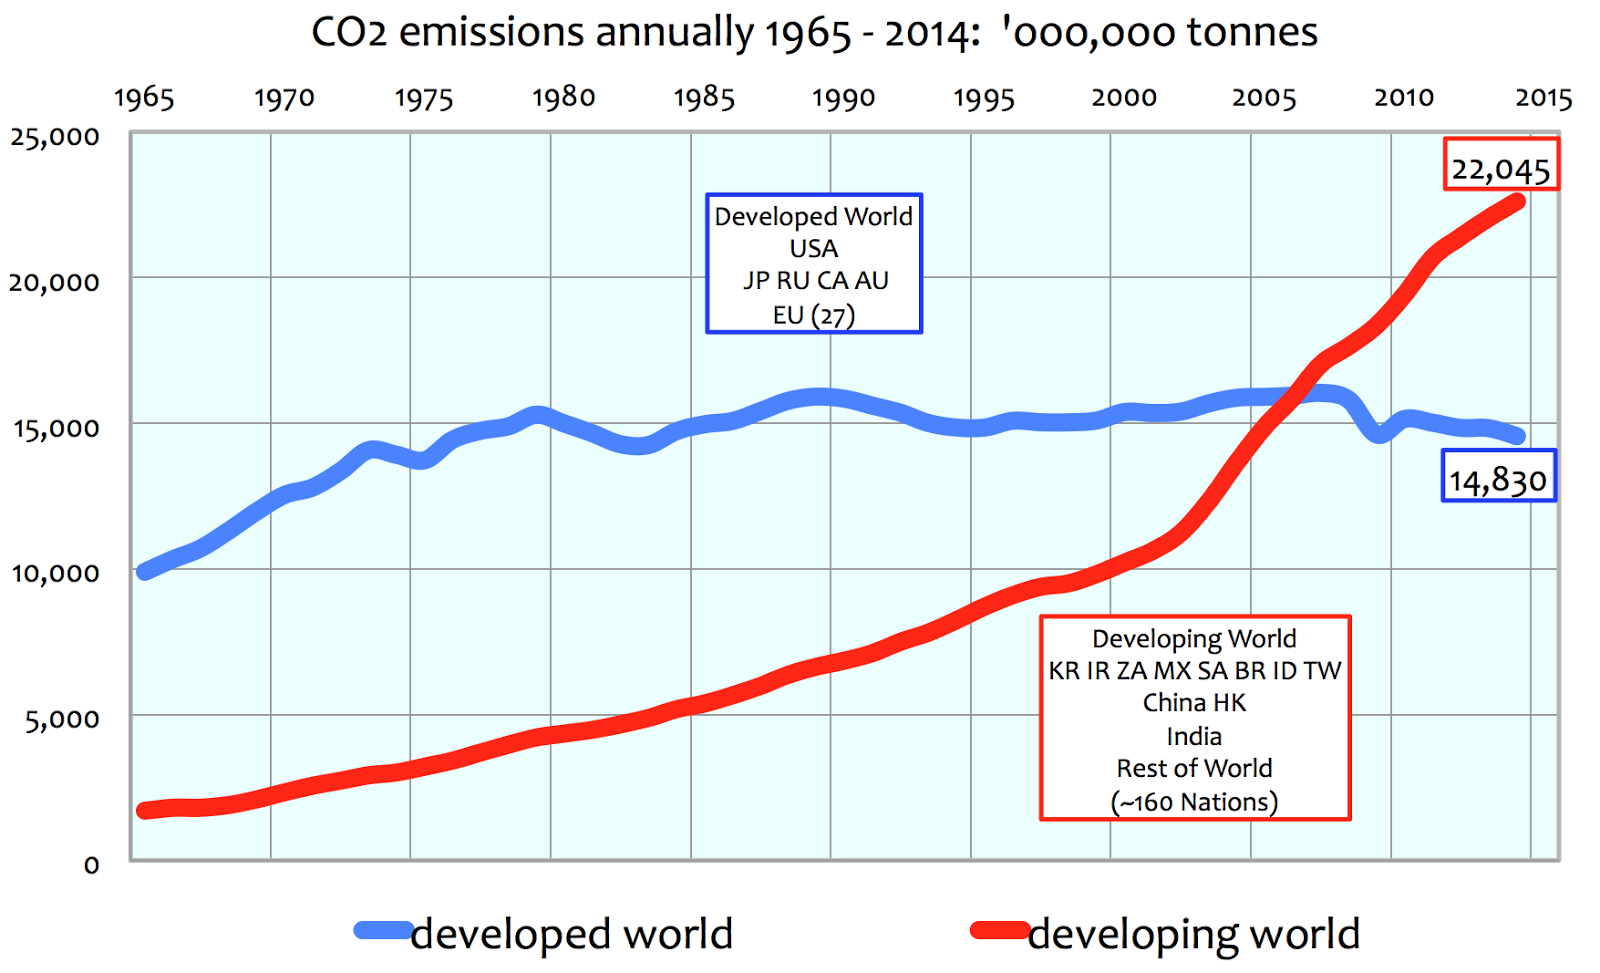
The countries of the world are now producing over 37 billion tons of CO2 per year.
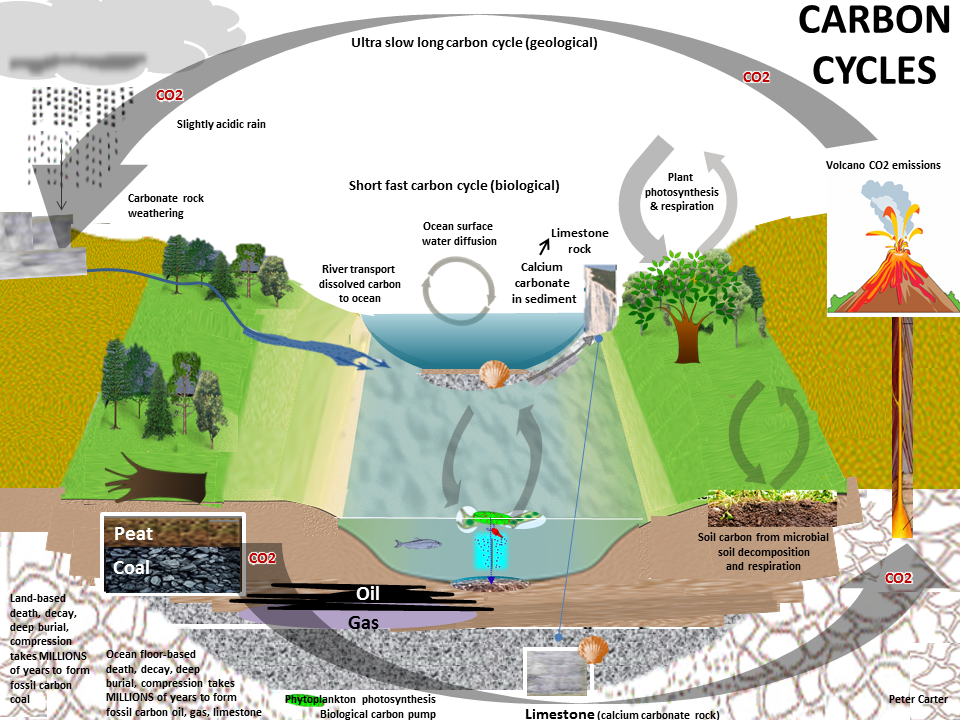
Although our output of 37 gigatons of CO2 is tiny compared to the 750 gigatons moving through the carbon cycle each year, it adds up because the land and ocean cannot absorb all of the extra CO2. About 40% of this additional CO2 is absorbed. The rest remains in the atmosphere, and as a consequence, atmospheric CO2 is at its highest level in 15 to 20 million years (Tripati 2009). (A natural change of 100ppm normally takes 5,000 to 20,000 years. The recent increase of 100ppm has taken just 120 years
Fixing the CO2 problem is first stopping the increase in CO2 production. Then it would be getting manmade CO2 production down to about zero then it would be removing CO2. Below the faster and cheaper and more productive effort would be to reduce particulate production first.
The total weight of the atmosphere is 5148 trillion tons
As of January 2007, the earth’s atmospheric CO2 concentration was about 0.0383% by volume (383 ppmv) or 0.0582% by weight. This represents about 2.996×10^12 tonnes, and is estimated to be 105 ppm (37.77%) above the pre-industrial average.
Nearly ten years later we are now 5% higher in CO2 concentration (403 instead of 383).
3.15 trillion tons of CO2.
An average of about 32 billion tons of CO2 were produced each year.
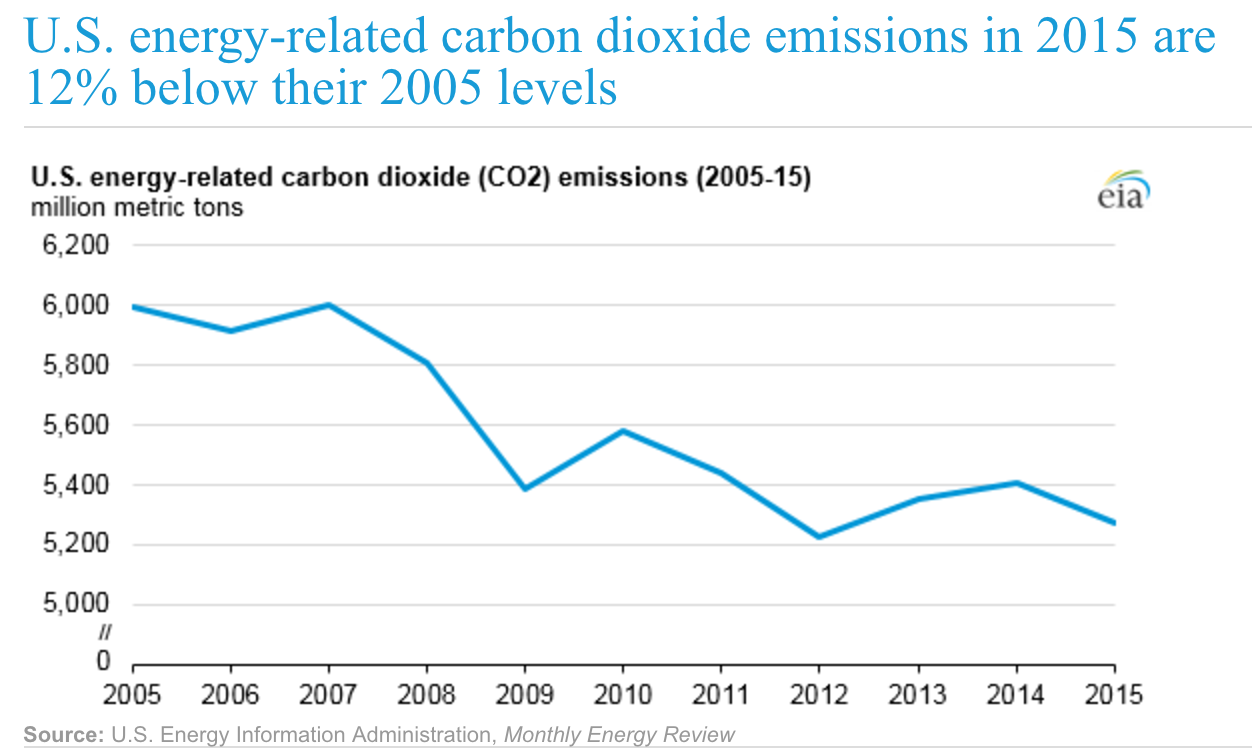
US went from 52% coal power to 32% coal by increasing usage of cheap natural gas
The US did not have to make that many more natural gas power plants, a fast shift from coal to natural gas was possible by increasing utilization of gas and decreasing the coal usage. A typical (500 megawatt) coal plant burns 1.4 million tons of coal each year. 10,000 tons every two days. Open hopper cars hold 100 to 125 tons coal or about use 115 tons/car. So an 80 hopper car train three times a week to each coal plant.
Natural gas produces half the CO2 compared the same power generated by coal.
If the power was produced by nuclear, solar or wind then the CO2 would be completely displaced.

The recent Paris climate accords are based upon voluntary targets for each country.
Individual carbon dioxide molecules have a short life time of around 5 years in the atmosphere. However, when they leave the atmosphere, they’re simply swapping places with carbon dioxide in the ocean. The final amount of extra CO2 that remains in the atmosphere stays there on a time scale of centuries.
Fixing air pollution is one of the quickest ways to save the most lives at the lowest cost and the fastest way to reduce global warming. If someone were seriously concerned about global warming then particulates and soot should be the first and primary focus because it would have the biggest and fastest impact. Carbon dioxide mitigation costs 20 times more and takes decades longer to bend the temperature curve.

A package of 16 measures could, if fully implemented across the globe, save close to
2.53.7 million lives a year; avoid crop losses amounting to 32 million tonnes annually and deliver near-term climate protection of about half a degree C by 2040.
Fixing soot would be as good as fixing 80% of the CO2 problem and could be done for 10 to 20 times lower cost, it would save about 5 million lives that are already known to be lost each year and it would impact climate about 30 to 50 years faster than CO2 fixes.
In particular, the new data reveal a stronger link between both indoor and outdoor air pollution exposure and cardiovascular diseases, such as strokes and ischaemic heart disease, as well as between air pollution and cancer. This is in addition to air pollution’s role in the development of respiratory diseases, including acute respiratory infections and chronic obstructive pulmonary diseases.
The new estimates are not only based on more knowledge about the diseases caused by air pollution, but also upon better assessment of human exposure to air pollutants through the use of improved measurements and technology. This has enabled scientists to make a more detailed analysis of health risks from a wider demographic spread that now includes rural as well as urban areas.
Regionally, low- and middle-income countries in the WHO South-East Asia and Western Pacific Regions had the largest air pollution-related burden in 2012, with a total of 3.3 million deaths linked to indoor air pollution and 2.6 million deaths related to outdoor air pollution.
Here is a 17 page report with more references.
.png)
Indoor (household) air pollution by region
After analysing the risk factors and taking into account revisions in methodology, WHO estimates indoor air pollution was linked to 4.3 million deaths in 2012 in households cooking over coal, wood and biomass stoves. The new estimate is explained by better information about pollution exposures among the estimated 2.9 billion people living in homes using wood, coal or dung as their primary cooking fuel, as well as evidence about air pollution’s role in the development of cardiovascular and respiratory diseases, and cancers.
In the case of outdoor air pollution, WHO estimates there were 3.7 million deaths in 2012 from urban and rural sources worldwide.
.png)
Many people are exposed to both indoor and outdoor air pollution. Due to this overlap, mortality attributed to the two sources cannot simply be added together, hence the total estimate of around 7 million deaths in 2012.
Included in the assessment is a breakdown of deaths attributed to specific diseases, underlining that the vast majority of air pollution deaths are due to cardiovascular diseases as follows:
Outdoor air pollution-caused deaths – breakdown by disease:
40% – ischaemic heart disease;
40% – stroke;
11% – chronic obstructive pulmonary disease (COPD);
6% – lung cancer; and
3% – acute lower respiratory infections in children.
Indoor air pollution-caused deaths – breakdown by disease:
34% – stroke;
26% – ischaemic heart disease;
22% – COPD;
12% – acute lower respiratory infections in children; and
6% – lung cancer

Brian Wang is a Futurist Thought Leader and a popular Science blogger with 1 million readers per month. His blog Nextbigfuture.com is ranked #1 Science News Blog. It covers many disruptive technology and trends including Space, Robotics, Artificial Intelligence, Medicine, Anti-aging Biotechnology, and Nanotechnology.
Known for identifying cutting edge technologies, he is currently a Co-Founder of a startup and fundraiser for high potential early-stage companies. He is the Head of Research for Allocations for deep technology investments and an Angel Investor at Space Angels.
A frequent speaker at corporations, he has been a TEDx speaker, a Singularity University speaker and guest at numerous interviews for radio and podcasts. He is open to public speaking and advising engagements.