


The bottom 20% have negative wealth. The -0.2% of the bottom 10% is more than the +0.1% of the next 10%. It takes getting to the collective bottom 25% (the bottom 1.76 billion) to get to a combined net worth of zero. Not even the poorest person has negative $230 billion net worth. The poorest person might be a fallen billionaire (maybe Eike Batiste who racks up huge losses but cannot get to -5 billion, but then they are forced into bankruptcy. The bottom 1.5 billion who have a -$170 billion or so collectively.
Oxfam keeps focusing on how many billionaires it takes to equal the combined wealth of the bottom 48 or 50% of people. However, there is more to be understood about how and why there is a period of indebtiness for many people.
* How should debt be safely available for the poor
* What are the effective ways to lift people out of debt and poverty. The biggest success was in China
* People need to become more productive and higher earning. Can debt be minimized for students while still providing increase in opportunity
* Part of basic education needs to be more numeracy and understanding of debt, risks, options and planning
Nextbigufuture has covered the report 2016, 2015, and 2014
To determine how global wealth is distributed across individuals, rather than regions or countries, the estimates of the level of household wealth across countries is combined with information on the pattern of wealth distribution within countries.
Once debts have been subtracted, a person needed only USD 2,220 to be among the wealthiest half of world citizens in mid-2016. However, USD 71,600 is required to be a member of the top 10% of global wealth holders, and USD 744,400 to belong to the top 1%. While the bottom half of adults collectively own less than 1% of total wealth, the richest decile (top 10% of adults) owns 89% of global assets, and the top percentile alone accounts for half of total household wealth.
The shares of the top 1% and top 10% in world wealth fell between 2000 and 2007: for instance, the share of the top percentile declined from 50% to 46%. However, the trend reversed after the financial crisis, and the top shares have returned to the levels observed at the start of the century
The world has a great number of people with relatively little wealth. According to the estimates, half of all adults in the world own less than USD 2,222, and the bottom 20% of adults own no more than USD 248. The average wealth of people in these slices of the distribution is correspondingly low: just USD 159 for the bottom 50% and minus USD 1,079 for the bottom 20%. The negative mean wealth of the bottom quintile reflects the fact that 44% of this bottom group are debtors, with average net debt of USD 2,628


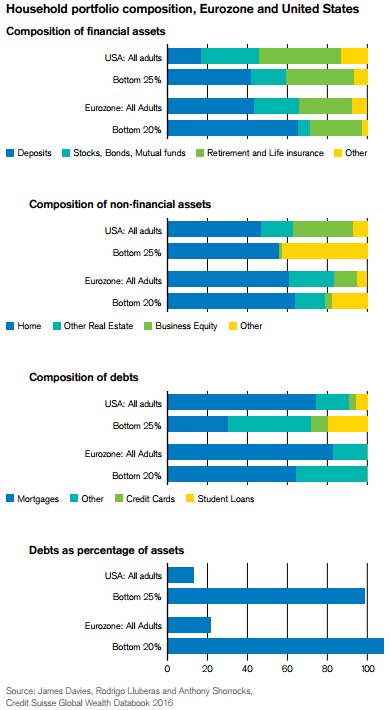
The type of assets held by low wealth holders, and their degree of indebtedness, are important to understanding the situation of the bottom billion. From the ECB surveys for the Eurozone conducted mainly in 2010, and from the US Survey of Consumer Finances for 2013 there is some insight into the assets of the poor. For both sets of data, the bottom groups are heavily indebted: debt-toasset ratios are around 100%. Financial assets are skewed toward deposits, and stocks, bonds and mutual funds are less important. The difference is much less marked in the United States, however, where these assets are more widely held than in Europe
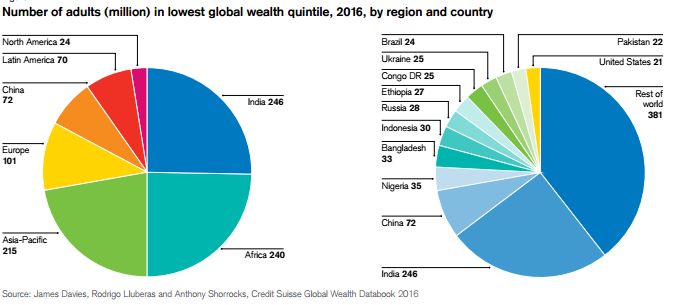
In population terms, the lower tail of the global wealth distribution is most concentrated in India and Africa, with sizable representation also in the less prosperous countries of the Asia-Pacific region. These three areas host 70% of the world’s least wealthy half, and 73% of the bottom wealth quintile. The calculations suggest that 80% of adults in Africa and India belong to the bottom half of the global wealth distribution. The incidence of wealth poverty is moderate in China and Latin America, with just 35% and 40% of adults respectively in the bottom 50%. With its very large population, China has 15% of the global number in this category, but since the turn of the century, its share of the global bottom quintile has fallen significantly, and is now only 7%. The places vacated by China in the global bottom quintile have been occupied by countries and regions with rapid growth of population relative to wealth, predominantly India and Africa.
There are significant numbers of people who are wealth poor by global standards in North America and Europe, with 9% of North Americans, most with negative net worth, in the global bottom quintile and 34% of Europeans in the global bottom half.
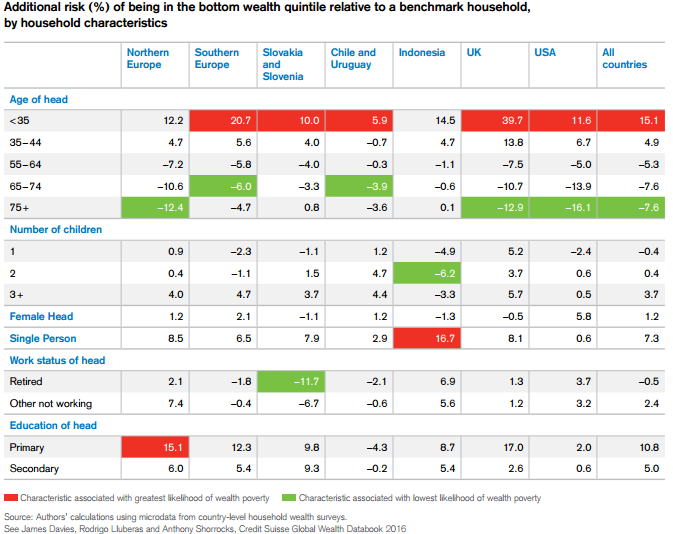
Within countries, the major “risk factors” for households being wealth poor are having a head who is young, single or poorly educated. The likelihood of a household being in the bottom wealth quintile tends to fall steadily with the age and education of the head, and is also lower for those in employment or retirement, and those who are married.

While the unemployed are over-represented among the wealth poor, the majority of those in the bottom wealth quintile are either employed or retired. Being well educated reduces the chances of being wealth poor, but it does not offer complete protection. In particular, it is not uncommon to find well-educated young people in the bottom wealth quintile. Although this is largely a consequence of young people being at the beginning of their life-cycle of wealth accumulation, it also reflects poorer job prospects in recent years and mounting student debt in some countries.

Brian Wang is a Futurist Thought Leader and a popular Science blogger with 1 million readers per month. His blog Nextbigfuture.com is ranked #1 Science News Blog. It covers many disruptive technology and trends including Space, Robotics, Artificial Intelligence, Medicine, Anti-aging Biotechnology, and Nanotechnology.
Known for identifying cutting edge technologies, he is currently a Co-Founder of a startup and fundraiser for high potential early-stage companies. He is the Head of Research for Allocations for deep technology investments and an Angel Investor at Space Angels.
A frequent speaker at corporations, he has been a TEDx speaker, a Singularity University speaker and guest at numerous interviews for radio and podcasts. He is open to public speaking and advising engagements.