
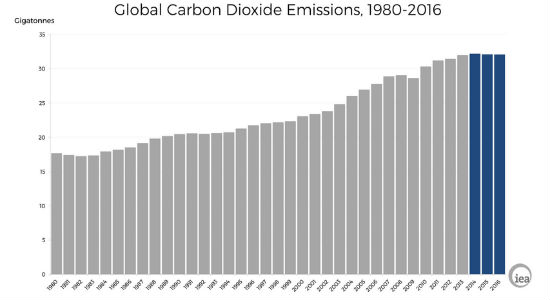
Global energy-related carbon dioxide emissions were flat for a third straight year in 2016 even as the global economy grew, according to the International Energy Agency, signaling a continuing decoupling of emissions and economic activity. This was the result of growing renewable power generation, switches from coal to natural gas, improvements in energy efficiency, as well as structural changes in the global economy.
Global emissions from the energy sector stood at 32.1 gigatonnes last year, the same as the previous two years, while the global economy grew 3.1%, according to estimates from the IEA. Carbon dioxide emissions declined in the United States and China, the world’s two-largest energy users and emitters, and were stable in Europe, offsetting increases in most of the rest of the world.
As of the beginning of 2011, the carbon budget for a 66% chance of staying below 1.5C was 400 billion tonnes. Emissions between 2011 and 2015 mean this has almost halved to 205 billion tonnes. The result is that, as of the beginning of 2016, five years and two months of current CO2 emissions would use up the 1.5C budget. Now in 2017 with emissions still at about 40 billion tons per year. The 66% chance of 1.5C budget has 3 years and 11 months. The equivalent remaining budgets for a 66% chance of staying below 2C and 3C are 19 years, and 54 years and three months (respectively) of current emissions. This assumes that emissions stop immediately once the threshold temperature is reached, which is essentially impossible in the real world. It also assumes there is no further warming once emissions have stopped, yet recent research shows this isn’t the case
The biggest drop came from the United States, where carbon dioxide emissions fell 3%, or 160 million tonnes, while the economy grew by 1.6%. The decline was driven by a surge in shale gas supplies and more attractive renewable power that displaced coal. Emissions in the United States last year were at their lowest level since 1992, a period during which the economy grew by 80%.
“These three years of flat emissions in a growing global economy signal an emerging trend and that is certainly a cause for optimism, even if it is too soon to say that global emissions have definitely peaked,” said Dr Fatih Birol, the IEA’s executive director. “They are also a sign that market dynamics and technological improvements matter. This is especially true in the United States, where abundant shale gas supplies have become a cheap power source.”
In 2016, renewables supplied more than half the global electricity demand growth, with hydro accounting for half of that share. The overall increase in the world’s nuclear net capacity last year was the highest since 1993, with new reactors coming online in China, the United States, South Korea, India, Russia and Pakistan. Coal demand fell worldwide but the drop was particularly sharp in the United States, where demand was down 11% in 2016. For the first time, electricity generation from natural gas was higher than from coal last year in the United States.
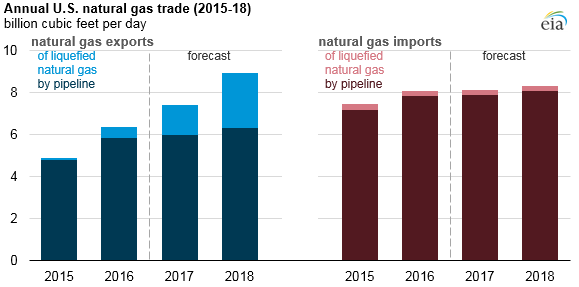
With the appropriate policies, and large amounts of shale reserves, natural gas production in the United States could keep growing strongly in the years to come. This could have three main consequences: it could boost domestic manufacturing, supply more competitive gas to Asia through to LNG exports, and provide alternative gas supplies to Europe

Two-thirds of China’s electricity demand growth, which was up 5.4%, was supplied by renewables — mostly hydro and wind – as well as nuclear. Five new nuclear reactors were connected to the grid in China, increasing its nuclear generation by 25%.

Market forces, technology cost reductions, and concerns about climate change and air pollution were the main forces behind this decoupling of emissions and economic growth. While the pause in emissions growth is positive news to improve air pollution, it is not enough to put the world on a path to keep global temperatures from rising above 2°C. In order to take full advantage of the potential of technology improvements and market forces, consistent, transparent and predictable policies are needed worldwide.
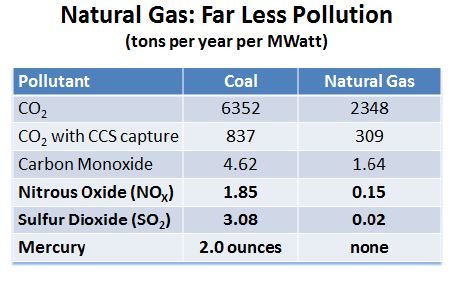
Natural gas produces half of the emissions of coal.
Consumption of natural gas worldwide is projected to increase from 120 trillion cubic feet (Tcf) in 2012 to 203 Tcf in 2040 in the International Energy Outlook 2016 (IEO2016) Reference case. By energy source, natural gas accounts for the largest increase in world primary energy consumption. Abundant natural gas resources and robust production contribute to the strong competitive position of natural gas among other resources. Natural gas remains a key fuel in the electric power sector and in the industrial sector.
Although the Chinese energy market has increasingly relied on imported natural gas, future shale gas production could help to meet natural gas demand even as the country faces difficulties in developing other natural gas resources, including coalbed methane (CBM). Over the past 25 years, China has worked to develop its substantial CBM resources, estimated by China’s Ministry of Land and Resources (MLR) at more than 1,000 Tcf.


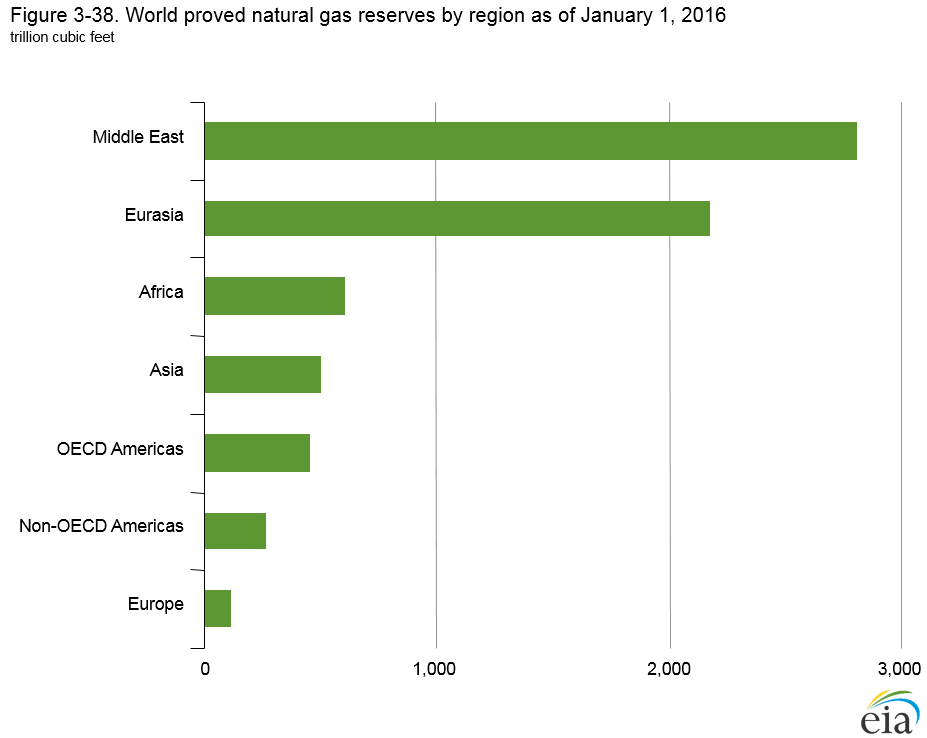
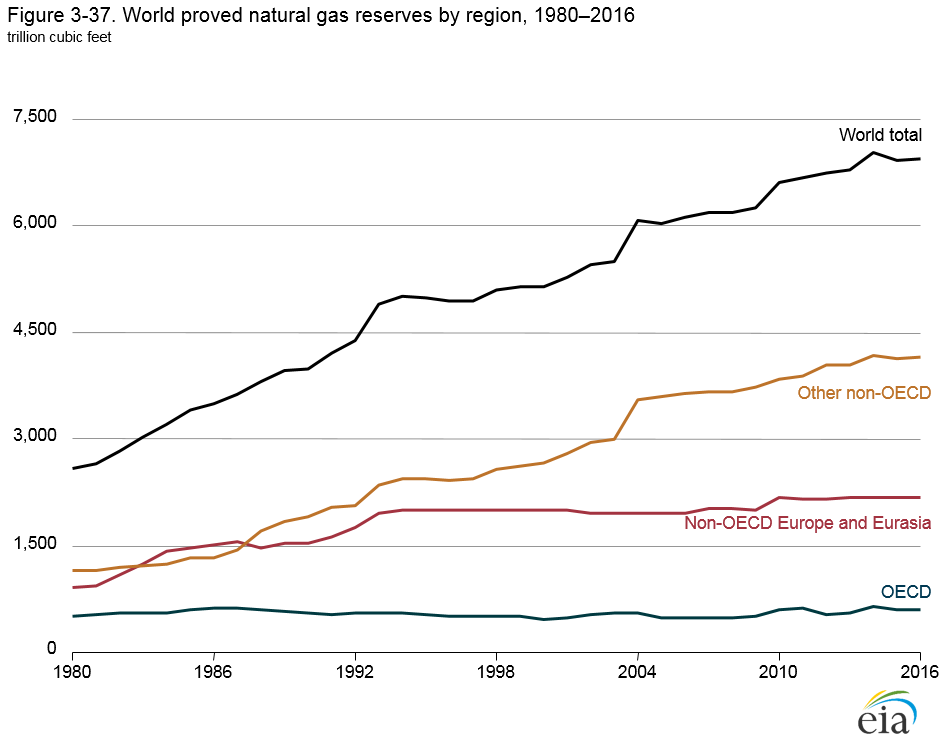
Global estimates place the gas volume (primarily methane) resident in oceanic natural gas hydrate deposits in the range of 30,000 to 49,100,000 trillion cubic feet (Tcf), and in continental natural gas hydrate deposits in the range of 5,000 to 12,000,000 Tcf. Worldwide natural gas resources are about 16,000 Tcf and natural gas reserves are about 7,000 Tcf.
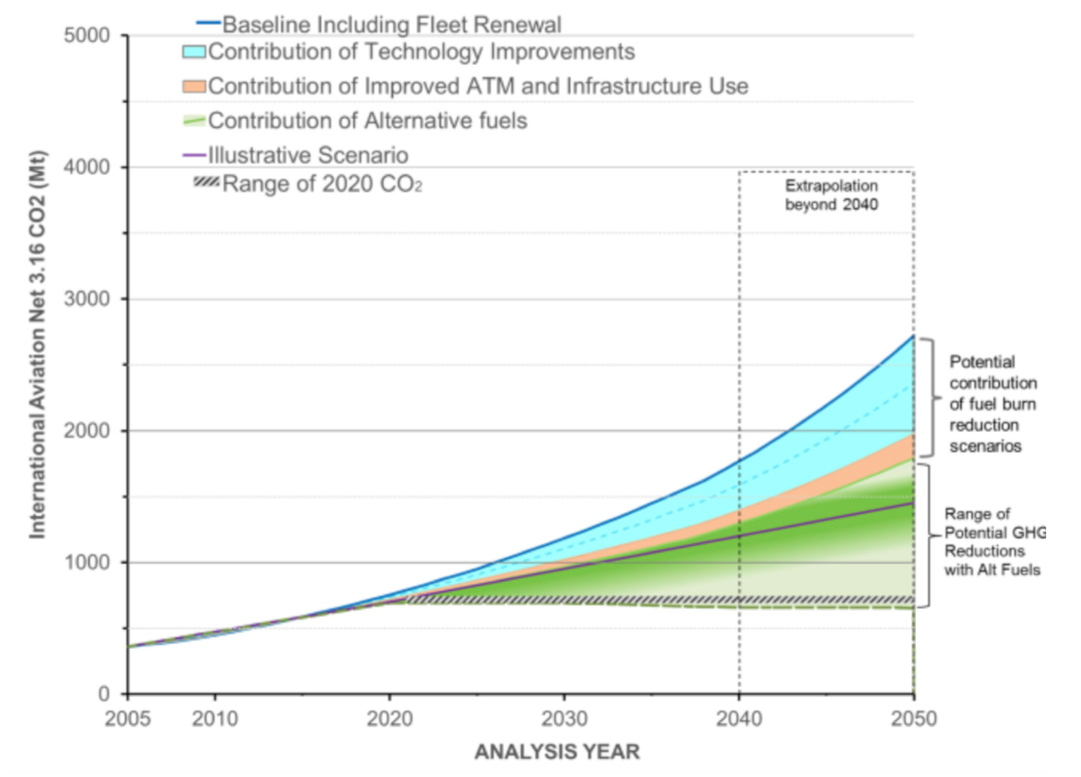
Aviation also will use up a lot of any CO2 budget and emissions at altitude have more impact on the climate.

Brian Wang is a Futurist Thought Leader and a popular Science blogger with 1 million readers per month. His blog Nextbigfuture.com is ranked #1 Science News Blog. It covers many disruptive technology and trends including Space, Robotics, Artificial Intelligence, Medicine, Anti-aging Biotechnology, and Nanotechnology.
Known for identifying cutting edge technologies, he is currently a Co-Founder of a startup and fundraiser for high potential early-stage companies. He is the Head of Research for Allocations for deep technology investments and an Angel Investor at Space Angels.
A frequent speaker at corporations, he has been a TEDx speaker, a Singularity University speaker and guest at numerous interviews for radio and podcasts. He is open to public speaking and advising engagements.