

Housing costs have become a burden for many U.S. households. Discussions of how to improve housing affordability often focus on the role of housing supply constraints, particularly regulations. However, recent research has documented that such constraints are unable to account for the differences in affordability, house price growth, or housing supply (unit) growth across metropolitan areas.
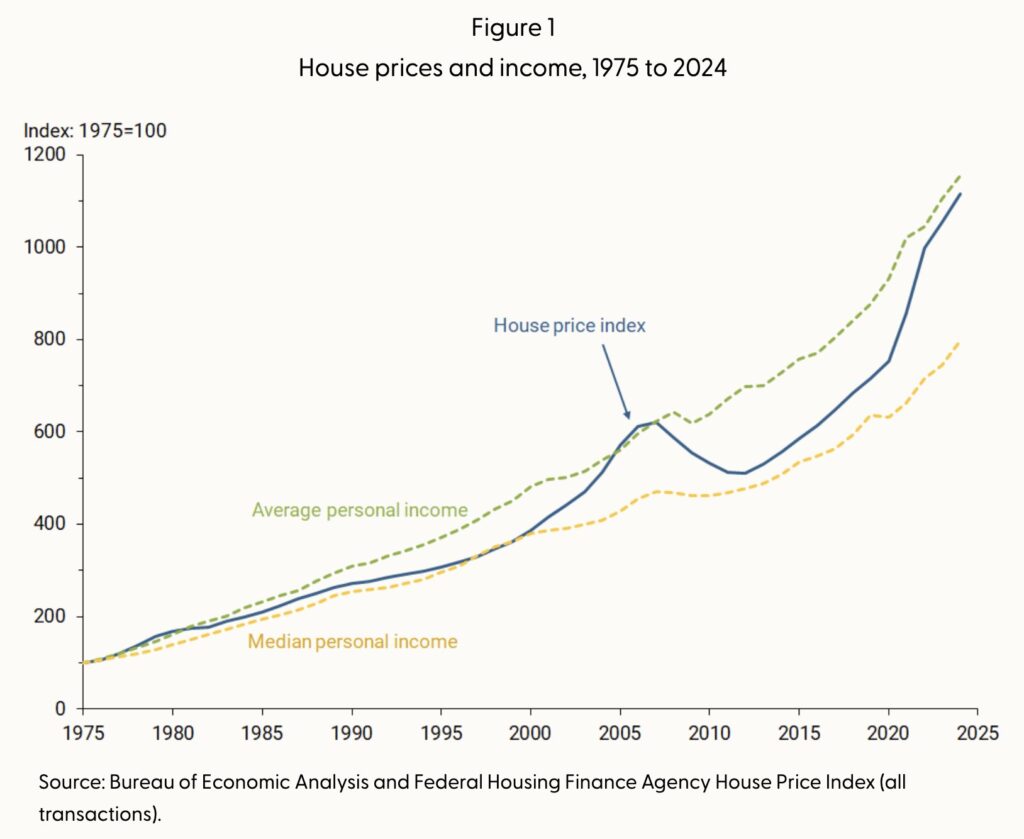
Federal Reserve Bank of San Francisco study focuses instead on the role of housing demand using two indicators: average income growth and population growth. Our research suggests that differences in demand as reflected in these two indicators can offer a better explanation for the variation in housing dynamics from 2000 to 2020 across metro areas.
Average income growth relates strongly to house price growth and that house prices generally keep pace with average income. However, there is almost no connection between average income growth and growth in housing supply. Instead, housing supply growth has a strong positive relationship with population growth. In fact, almost all metro areas saw housing units grow faster than their population—even in expensive residential markets like Los Angeles or San Francisco.

Brian Wang is a Futurist Thought Leader and a popular Science blogger with 1 million readers per month. His blog Nextbigfuture.com is ranked #1 Science News Blog. It covers many disruptive technology and trends including Space, Robotics, Artificial Intelligence, Medicine, Anti-aging Biotechnology, and Nanotechnology.
Known for identifying cutting edge technologies, he is currently a Co-Founder of a startup and fundraiser for high potential early-stage companies. He is the Head of Research for Allocations for deep technology investments and an Angel Investor at Space Angels.
A frequent speaker at corporations, he has been a TEDx speaker, a Singularity University speaker and guest at numerous interviews for radio and podcasts. He is open to public speaking and advising engagements.