
Mark Jacobson has responded to Barry Brooks criticism of Mark’s proposed 2030 plan for complete powering of civilization with solar, wind and hydro power. Mark Jacobson is the Stanford professor who adds the CO2 from burning cities into his calculation of CO2 generated by nuclear power and the deaths from nuclear war from his calculation of deaths from commercial nuclear power.
He points out that the nuclear war CO2 is not a big part of his nuclear energy lifecycle CO2 calculation. Most of it is because he assumed 10-19 years to build a nuclear power plant and to assign the CO2 generated from coal power in the meantime to nuclear power.


Jacobson’s calculation solar pv delays assumes that solar PV is ready now for a substantial role in reducing CO2. When solar is still needing more research and development and new factories to be built.
Also, nuclear power is already displacing a large amount of fossil fuel. The fossil fuel it would take to generate 2800 TWh of electricity,
A 10% increase in nuclear power via power uprates and operational efficiency could be done faster than an increment in new wind and solar build. 280 TWh within five years.
Dual cooled fuel could achieve 20-50% uprates. and South Korea should start performing those uprates by 2020.
Jacobson ignores any examination of supply chain scaling issues with increased solar, wind and hydro and he ignore siting issues. The impact of the incremental projects on costs is assumed to be flat. Previously when heavy subsidization of solar and wind power caused increased costs for solar and wind and caused delays with shortages of materials and components. He also assumes that if you were to cancel or abandon an Areva nuclear power plant project or a coal power project that this would automatically flow over to an increase in replacement solar, wind and hydro projects.
Regular CO2 Lifecycle Calculations
UVDiv point out this statement from Jacobson.
With respect to the lifecycle emissions, the range included in Table 3 of the above paper includes the nuclear energy industry estimate of 9 g-CO2e/kWh as well as a number just above the AVERAGE of 103 published lifecycle emission studies (70 g-CO2e/kWh).
Is false. The paper cited gets the figure from citation #50, which points to this paper by the kook Sovacool. It “reviews” 103 papers, but it discards most of them, using a subset of 19 studies for the published average. (c.f. table #6). And as a measure of how likely those numbers actually are, simply note that e.g. three of them are by Storm van Leeuwen.
Lack of Internal Consistency
Besides the flaws in the whole Jacobson approach his methods are not even internally self consistent.
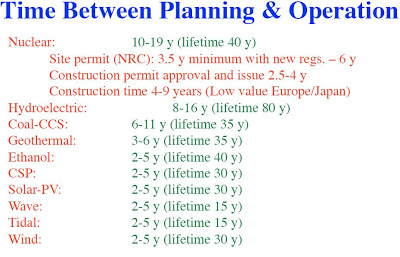
Let me add some points to the time to displace CO2 by energy source and to the imagined deaths from imagined war scenarios.
The whole opportunity costs for CO2 are ramped up and are bogus. Even playing within the ridiculous assumptions the bias can be seen.
But in particular the nuclear numbers are particularly bad because the assumption is that nuclear needs about ten years to add new plants and new power.
Existing nuclear can and are being uprated. There is also the dual cooled nuclear fuel technology invented at MIT (annular fuel) and being developed for deployment in South Korea. This technology will enable existing nuclear plants to have up to 50% more power. Current uprates can achieve 20% increases in power. Uprates take 18-24 months to implement and can be performed during the time planned for a regular fuel change.
There are still operational efficiency gains for existing plants in Ukraine, Japan and other countries.
Construction times are going down with modular construction. South Korea’s construction times are down to 48 months and are heading down to 36 months.
The 200MWe chinese pebble bed reactor is starting construction in 2009 and should be completed in 2013. This should be followed by dozens of factory mass produced reactors with construction times heading to 2 years.
The high temperature reactors (like the pebble bed) can be compatible with conversion of existing coal facilities over to nuclear power. Thus reusing the grid and steam generators and the power plant sites.
So building nuclear and accelerating nuclear development can have substantial impact faster. He compares worst case business as usual for nuclear and does not look at what is already being done to accelerate nuclear development. Then assumes a crash program for solar and wind and hydro which does not exist.
For nuclear fuel, Russia is completing its 880 MWe Baloyarsk 4 nuclear breeder reactor. China is buying two of those reactors. India is completing a breeder and will have four others done by 2020.
For the nuclear proliferation
Proliferation is more a matter of key knowledge. The key knowledge was proliferated by Pakistan’s AQ Khan back in the seventies through the nineties. Knowledge of bombs and centrifuges. The first 64 years of the nuclear weapon age has seen zero deaths from proliferated nuclear weapons. Plus there is no example of proliferation from a commercial nuclear energy program to nuclear weapons.
AQ Khan was the source of proliferation of nuclear weapons knowledge. Any new commercial nuclear reactors are not related to that historical proliferation of knowledge. There would need to be shown incremental risk from new nuclear reactor build for the case to be made that building more commercial nuclear reactors increases the risk of proliferation. The case needs to then be made showing that increased nuclear weapons increases the risk for nuclear war.
The belief that there is nuclear power leads to nuclear weapons is wrong. Countries get nuclear weapons firstly and directly.
USA bombs first. (Hiroshima, Nagasaki – pre-nuclear power). 1957 first reactor
USSR bombs first. 1949 first bomb. first nuclear reactor June 27, 1954
United Kingdom first nuclear weapon 1952, first reactor 1956
France tested its first nuclear weapon in 1960, first reactor 1963
China first nuclear weapon in 1964, reactor 1991
India 1974, first reactor 1969 (exception to the bomb first)
Pakistan 1998, Karachi 1972 (exception to the bomb first). they used
Pakistan achieved their nuclear weapon material with secret enrichment, centrifuges, not with material from the commercial program.
North Korea 2005 bomb, no commercial reactor
Israel late 1960s, bombs no commercial reactor
Incremental Risk and Lack of Correlation
Where is the incremental risk from more commercial reactors ? There were tens of Thousands of nuclear bombs before there were significant commercial nuclear power.
![]()
France added about 50 commercial nuclear reactors in the 1980s. But only USSR/Russia were making a lot more bombs during that period. Mainly USSR/Russia.
By 1990, there were 70,000 nuclear bombs with about 98-99% in USSR and USA.
The nuclear weapons buildup was independent of the civilian nuclear energy build.
Where is the correlation between those 70,000 bombs and actual nuclear war and nuclear deaths ? It was the military posture of hair triggers that had some accident risk, but that policy is no longer in place. A strong case is made that nuclear weapons deterred wide conventional war. Thus there needs to be the calculation for lives saved from prevented wars.
Going forward China, India, Russia, South Korea, Japan are going to be building most of the new commercial nuclear reactors and the USA depending on politics will also build several. How does this correlate to increased proliferation and increased risk?
Highly enriched uranium (HEU) is being down-blended for reactor fuel. Thus commercial nuclear reactors reduced any risks from higher stockpiles of HEU.
Hydro Power Not Given a Worst Case Scenario
For the hydro power – an all out war scenario needs to look at the majority of hydro dams being blown up and the number of deaths calculated from the flooding.
Banqiao Reservoir Dam break killed 90,000-230,000 in 1975.
Over 2000 dams in the USA near population centers need repair.
Dam buster bombs and raids in world war 2.
Mohne Dam bombed on the night of May 16/17 1943. The attack successfully breached the dam and caused widespread loss of life and destruction. almost 1,300 people died in the floods following the dam bombing, many of them Ukrainian women and children, trapped in a German prisoner of war camp below the Mohne dam.
The resulting huge floodwave killed at least 1579 people, 1026 of them foreign forced laborers held in camps downriver. The small city of Neheim-Hüsten was particularly hard-hit with over 800 victims, among them at least 526 victims in a camp for Russian women held for forced labor

Brian Wang is a Futurist Thought Leader and a popular Science blogger with 1 million readers per month. His blog Nextbigfuture.com is ranked #1 Science News Blog. It covers many disruptive technology and trends including Space, Robotics, Artificial Intelligence, Medicine, Anti-aging Biotechnology, and Nanotechnology.
Known for identifying cutting edge technologies, he is currently a Co-Founder of a startup and fundraiser for high potential early-stage companies. He is the Head of Research for Allocations for deep technology investments and an Angel Investor at Space Angels.
A frequent speaker at corporations, he has been a TEDx speaker, a Singularity University speaker and guest at numerous interviews for radio and podcasts. He is open to public speaking and advising engagements.