

Among the predictions that I made in 2006 (about 6 years ago) were two predictions on China’s economy.
China second largest economy in straight currency conversion measures   2013-2015
China largest economy in PPP (Purchasing Power Parity) terms            2009-2012
China overtook Japan in 2010 in terms of being the second largest economy in currency conversion measuers. Japan’s economy was weaker than I expected.
By 2008, I had realized and forecast that China would pass Japan in 2010.
China Largest based on Purchasing Power Parity
A 37 page paper indicates that China’s World Bank 2005 PPP estimate is 50% too low. Their analysis is important, not just because it is carefully done, but also because Professor Feenstra will be leading the effort to produce the next generation of the Penn World Table GDP (PPP-based) estimates.
The latest World Bank estimates of real GDP per capita for China are significantly lower than previous ones. We review possible sources of this puzzle and conclude that it reflects a combination of factors, including substitution bias in consumption, reliance on urban prices which we estimate are higher than rural ones, and the use of an expenditure-weighted rather than an output-weighted measure of GDP. Taking all these together, we estimate that real per-capita GDP in China was 50% higher relative to the U.S. in 2005 than the World Bank estimates.
The current Penn World Tables 7.0 indicate that China is the largest economy on PPP basis in 2012
My 2007 predictions of Chinas GDP growth, which I have updated were basically year by year predictions and have been fairly accurate for china and for the USA. They were a lot more accurate than Goldman Sachs and other predictors.
In trillions of dollars, 2007 Predictions for GDP for China and the USA :
| Year | GDP(yuan) | Yuan per USD | China GDP | US GDP |
| 2006 | 20.94 | 7.8 | 2.7 | 13.2 |
| 2007 | 23.24 | 7.4 | 3.1 | 13.6 |
| 2008 | 25.57 | 6.9 | 3.7 | 14.0 |
| 2009 | 28.12 | 6.4 | 4.4 | 14.4 |
| 2010 | 30.66 | 6.0 | 5.2 | 14.9 |
| 2011 | 33.11 | 5.5 | 6.0 | 14.9 |
| 2012 | 35.76 | 5.1 | 6.9 | 15.8 |
| 2013 | 38.62 | 4.8 | 8.1 | 16.2 |
| 2014 | 41.7 | 4.5 | 9.4 | 16.7 |
| 2015 | 45.0 | 4.1 | 10.9 | 17.2 |
| 2016 | 48.2 | 3.9 | 12.5 | 17.7 |
| 2017 | 51.9 | 3.6 | 14.2 | 17.7 |
| 2018 | 54.2 | 3.3 | 16.2 | 18.3 |
| 2019 | 57.4 | 3.1 | 18.5 | 19.4 |
| 2020 | 60.9 | 2.9 | 21.1 | 20.0 |
By 2008, I had settled in on the 2017-2018 date for China passing the US on exchange rate basis.
My 2008 prediction for China at the end of 2011 was $7.0 trillion GDP for end of 2011.
Other Predictions over similar date ranges were off by 50% or more
A 2003 report by Goldman Sachs was used as the basis of many future scenarios. They projected China overtaking the US economy in 2040. They projected a lower growth rate for China for 2005-2010 of 7.2%. China grew 10.2% in 2005, 10.7% in 2006 and is on track for 10.9% in 2007. Projections vary for 2008 but 9-11% seems likely. The 17% underassessment of China’s economy before the 2004 census was not available. Goldman projected 268% currency appreciation over 47 years. The Goldman projections looks like it will be underestimating China’s GDP by 50% in 2010.
The Economist Intelligence Unit predicted China surpassing the US on an exchange rate basis in 2026 Changing the currency appreciation to 7.5% instead of 5% accelerates the date of overtaking from 2026 to 2020. They must also predict a slower growth rate of about 6-7% per year. (EIU predicted in 2005). In 2011, the Economist magazine began predicting that China would pass the USA GDP on an exchange rate basis in 2018. This is three years after I had shifted from 2020 to 2017-2018.
China Official Actual GDP Growth Compared to Targets

Sources: Central People’s Government of the People’s Republic of China, IMF; as of 03/05/2012. IMF estimated growth rates are based on constant 1990 prices in Chinese yuan
Fisher Investments writing at theStreet.
Looking forward to 2030
I looked recently at forecasts for China’s provinces and updated the GDP projections.
Year GDP(yuan) GDP growth USD/CNY China GDP China+HK US GDP


2011     47.2   9.2        6.3     7.5        7.8       15.2
2012     53     8.0        6.1     8.7        9.0       15.9
2013     59     8.5        5.8    10.2       10.5       16.5
2014     66     8.5        5.5    11.9       12.2       17.2
2015     73     8.5        5.2    14         14.3       18
2016     80     8          4.9    16.3       16.7       18.8
2017     88     8          4.6    19.1       19.5       19.6
2018     97     8          4.3    22.6       23         20.5
2019    107     8          4.1    26         26.5       21.5
2020    115     7.5        3.9    29.6       30         22.4
2021    125     7.5        3.7    33.7       34.2       23.4
2022    135     7.5        3.5    38.5       39         24.5
2023    145     7          3.3    44         44.5       25.6
2024    157     7          3.1    50.6       51         26.7
2025    170     7          3      56.5       57         27.9
2026    183     7          3      61         61.5       29.2
2027    198     7          3      66         66.4       30.5
2028    214     7          3      71.2       72         31.9
2029    235     7          3      78.4       79         33.3
2030    259     7          3      86.4       87         34.8
China has shifted their official national GDP growth target from 8.0% to 7.5%.
In 2011, the growth target was 8% for 2011, the growth target for the remaining years of the 12th five-year-plan period would be 7% per year.
“It’s never really a target, it’s more about setting a floor for growth,” said Wang Tao, chief China economist at UBS. “We still expect growth above 8%.”
China has regularly exceeded the old 8% target by a 1 to 4% over the last 15 years.

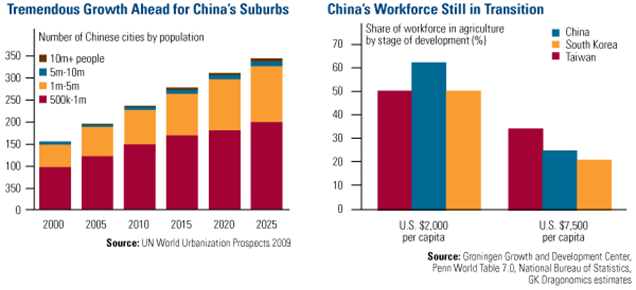
China still has a lot of urbanization in its future.
China recently had some hukou reform
The Chinese government has relaxed its policy on household registration to allow the country’s over 100 million migrant workers to apply for difficult-to-obtain residency registration permits, known as hukous, in small and medium cities. The policy also pledges to ban any new hukou policy or abolish existing ones that affect where people choose to work and enroll their children in schools. The new policy opens small and medium cities to farmers, but not the big metropolises of which many of them have dreamed.
People in the cities make three times as much as those in rural areas. With hukou reform and improving the system for absorbing people into the cities and providing them with more of financial and medical services will increase consumer spending and increase the number of people at higher wages. This will increase productivity and GDP.
1%-2% migration absorbed into cities means 3-6% GDP boost.

Brian Wang is a Futurist Thought Leader and a popular Science blogger with 1 million readers per month. His blog Nextbigfuture.com is ranked #1 Science News Blog. It covers many disruptive technology and trends including Space, Robotics, Artificial Intelligence, Medicine, Anti-aging Biotechnology, and Nanotechnology.
Known for identifying cutting edge technologies, he is currently a Co-Founder of a startup and fundraiser for high potential early-stage companies. He is the Head of Research for Allocations for deep technology investments and an Angel Investor at Space Angels.
A frequent speaker at corporations, he has been a TEDx speaker, a Singularity University speaker and guest at numerous interviews for radio and podcasts. He is open to public speaking and advising engagements.